ACM CHI 2026 · Barcelona · Research paper
SCORE: A Framework for Quantifying Diegesis in Situated Visualization for Augmented Reality
SCORE is a way to judge how naturally augmented reality (AR) visualizations fit into real-world settings. It rates a visualization on five dimensions, from 0 to 5, and combines them into a single score, so designs that earlier frameworks treated as the same can finally be told apart.
Tarik Hasan, Khalad Hasan, Barrett Ens
The University of British Columbia, Kelowna, BC, Canada
CHI '26, April 13–17, 2026, Barcelona, Spain · doi.org/10.1145/3772318.3791911
- AR visualization papers surveyed
- 50
- visualizations scored
- 67
- expert raters
- 21
- Krippendorff’s α, every dimension
- .815–.926
The five dimensions
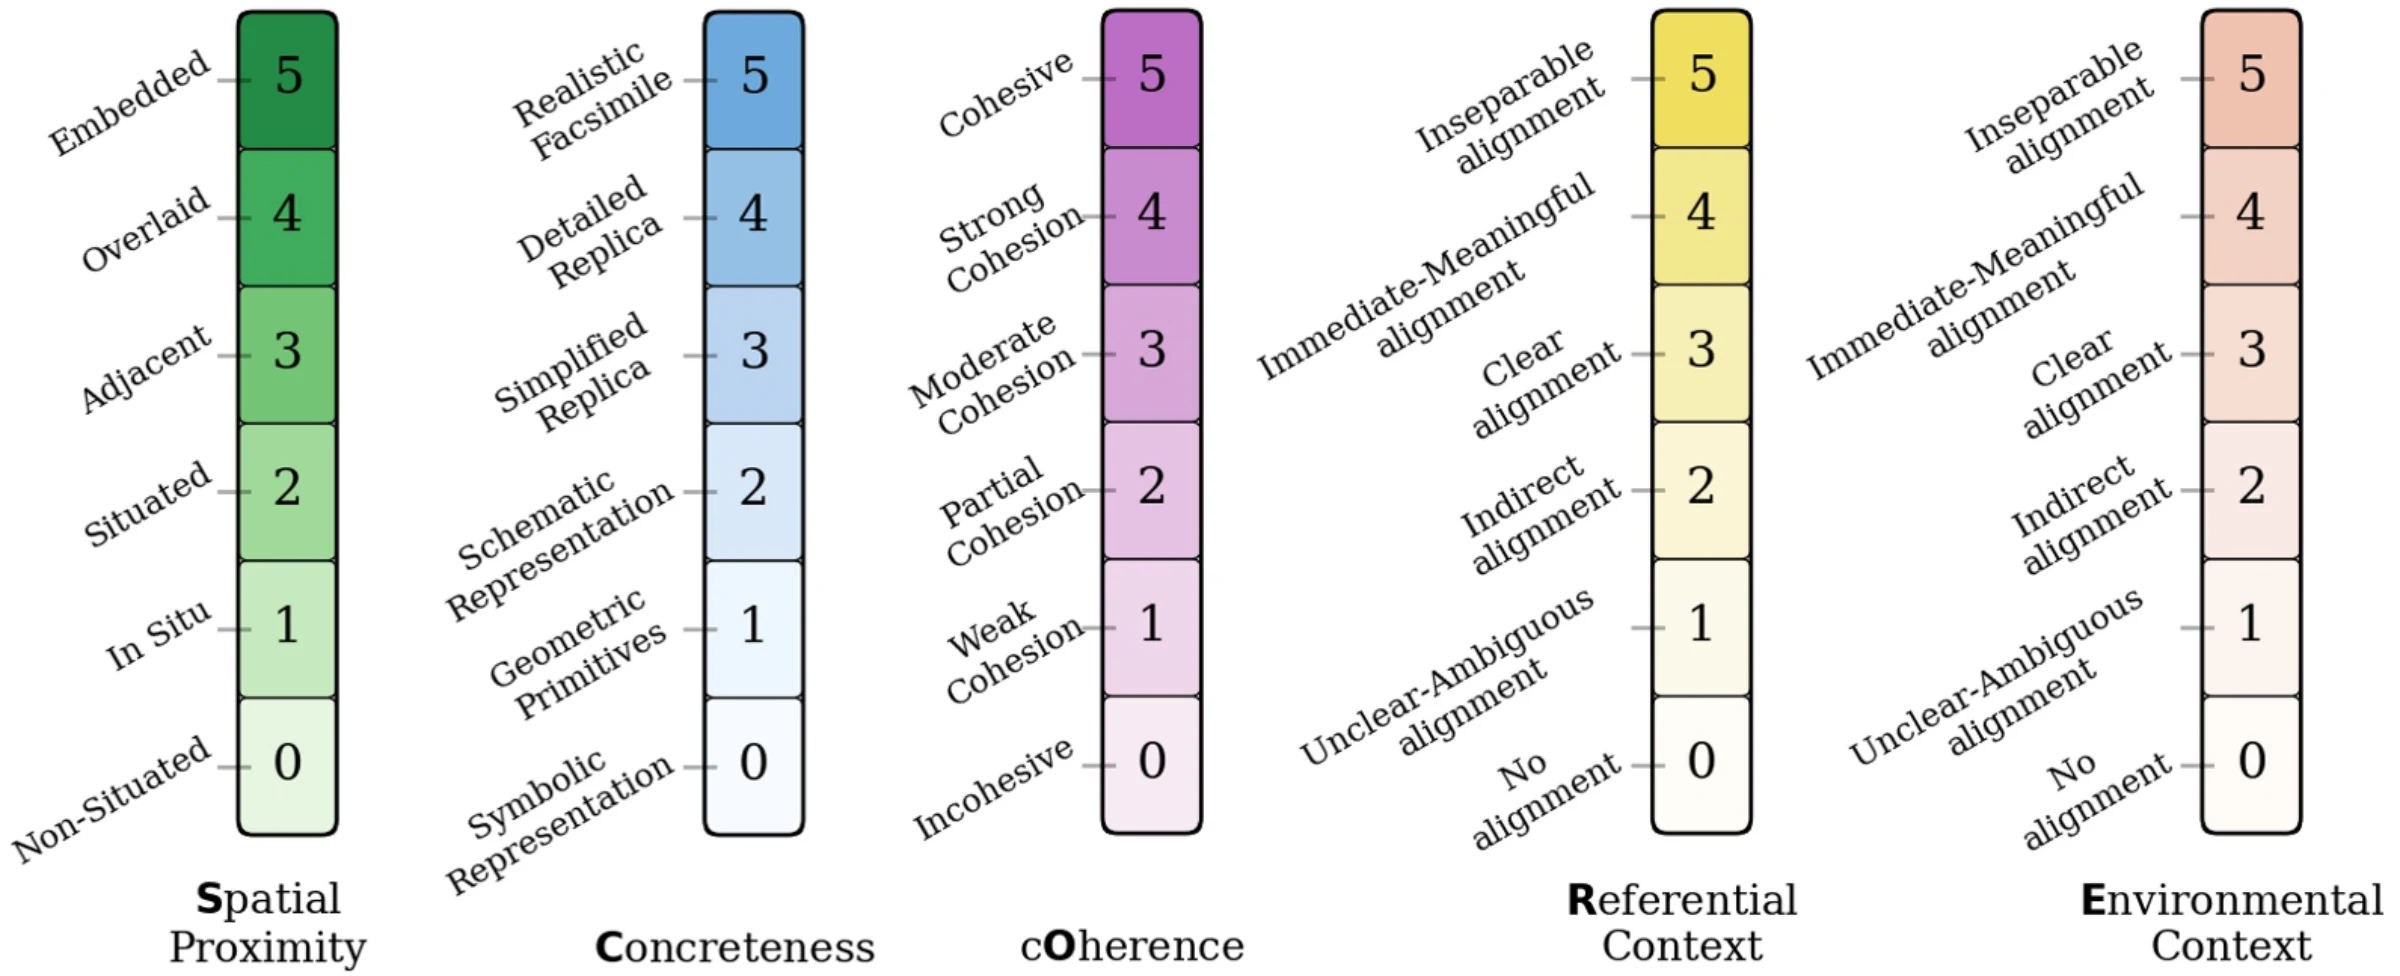
SCORE rates a visualization from 0 to 5 on five dimensions, and their initials spell its name. A weighted sum turns them into one number, also from 0 to 5. The weights come from how the dimensions varied across 67 real AR designs. A high score means the visualization feels like part of the scene; it is a description, not a grade, so a dashboard can score low and still be the right choice.
Spatial proximity
How close is it to the thing it describes?
0 Non-situated to 5 Embedded
Weight0.09Concreteness
Does it look like a real object, or an abstract symbol?
0 Symbolic to 5 Realistic facsimile
Weight0.15Coherence
Does it look and behave the way you'd expect in the real world?
0 Incohesive to 5 Cohesive
Weight0.29Referential context
How clearly does it relate to the object it describes?
0 No alignment to 5 Inseparable
Weight0.14Environmental context
Does it make sense in its surroundings?
0 No alignment to 5 Inseparable
Weight0.33
SCORE = 0.09 S + 0.15 C + 0.29 O + 0.14 R + 0.33 E
Contents
Abstract
A central goal of Augmented Reality (AR)-based Situated Visualization (SV) is to seamlessly integrate digital information into its relevant physical context. While existing frameworks describe numerous design dimensions, the field lacks a rigorous model to evaluate this integration. To address this, we introduce SCORE, a framework for quantifying diegesis - a narratology concept describing the extent to which an element belongs to its narrative world. Grounded in a systematic analysis of 50 contemporary SV works, SCORE defines five dimensions of diegesis in SV: Spatial proximity, Concreteness, cOherence, Referential context, and Environmental context. In addition to qualitative comparison, our framework also provides a quantitative measure of diegesis, enabling SCORE to distinguish AR-based SVs that prior models have treated as theoretically equivalent. We validate the framework by demonstrating a consistent correlation between higher scores and positive usability outcomes. Based on these findings, we offer insights for SV designers.
Keywords: Situated Visualization, Diegesis, Immersive Analytics, Framework
1Introduction
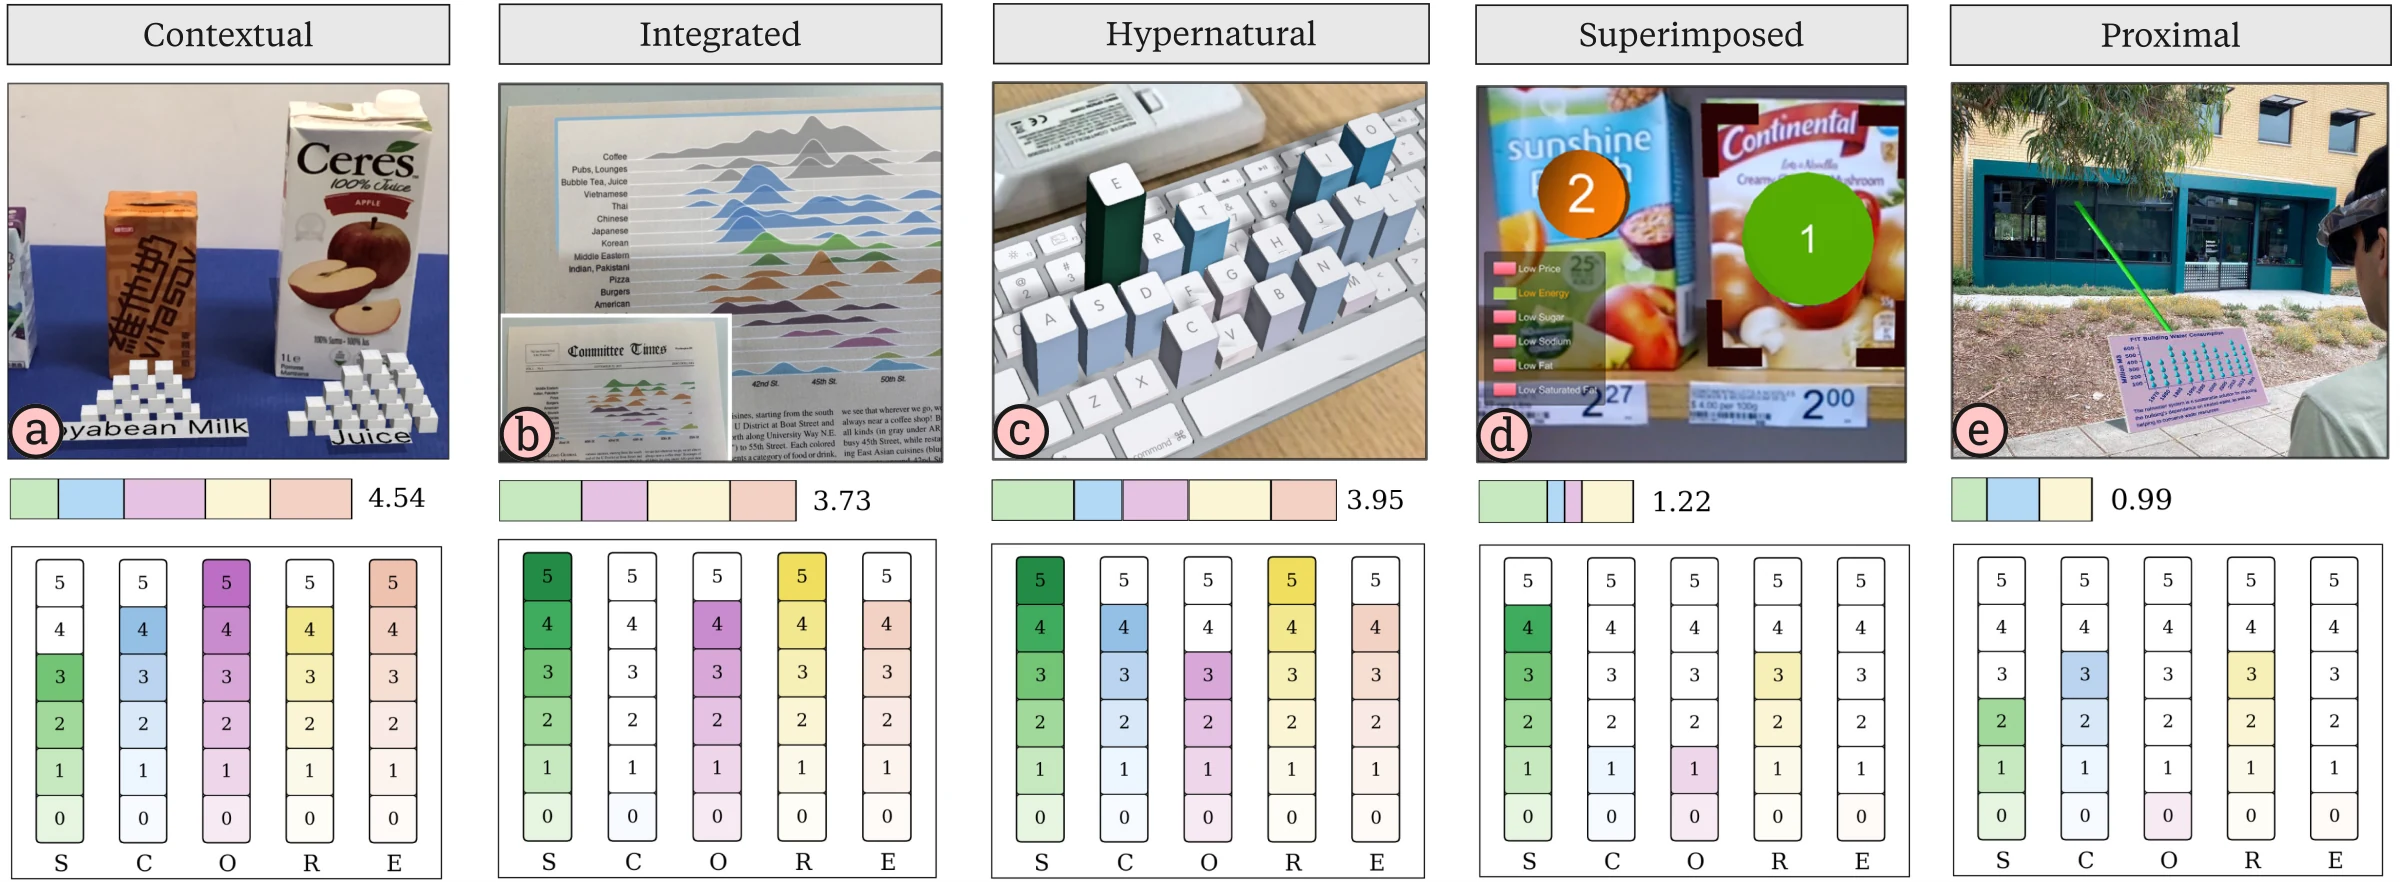
The promise of AR-based Situated Visualization (SV) is to bridge the gap between digital data and the physical world by placing information directly in the context where it originates [49, 81, 82]. Advances in AR now allow designers to move beyond screen-based interfaces and spatially co-locate visualizations with their physical referents, i.e., the spaces, objects, and entities to which the data refers [82]. For instance, a product’s sugar content can be represented via virtual sugar cubes stacked beside it (Figure 1a). By integrating data into its real-world context, SV aims to make information more immediate, relevant, and interpretable.
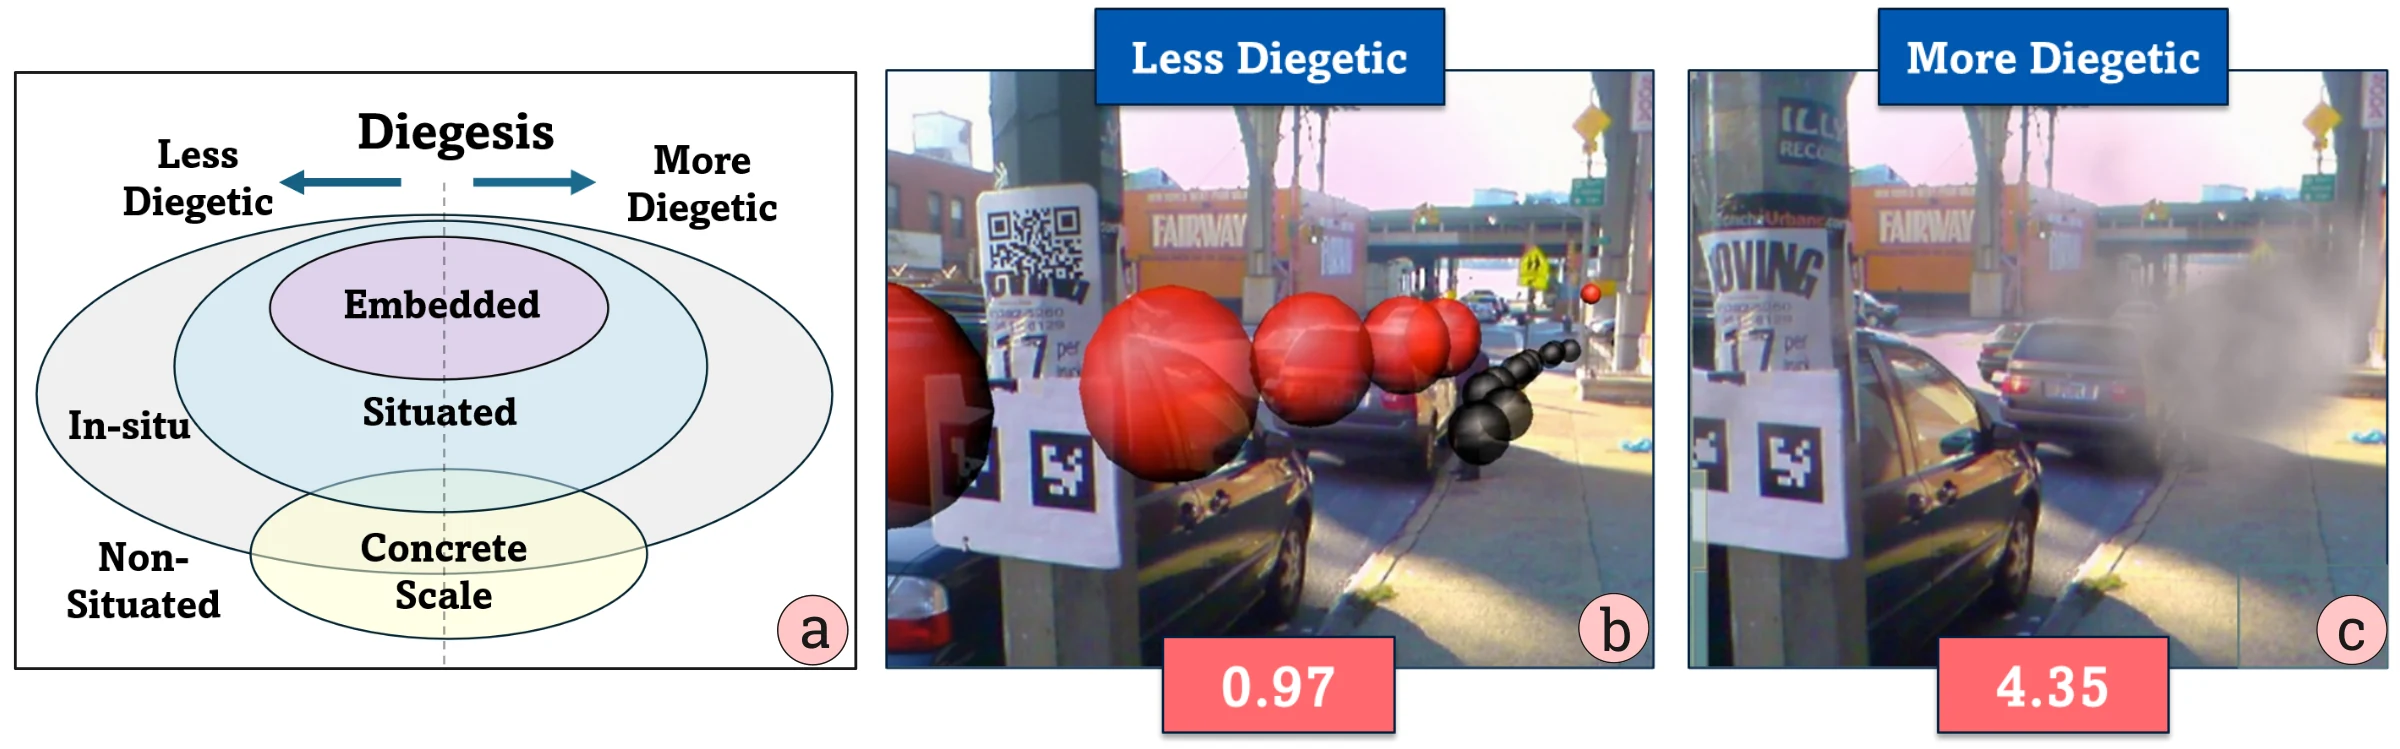
While recent conceptual frameworks [8, 49, 70, 82] have advanced the field by offering taxonomies based on spatial positioning [49, 69, 82] or context [8, 79, 81], they often overlook a fundamental design consideration: the quality of a visualization’s integration into its surrounding environment. For instance, visualizing air quality as virtual smoke (Figure 2c) feels intrinsically part of the urban landscape, whereas abstract spheres representing the same data (Figure 2b) may appear as jarring overlays. Yet existing models [49, 82] classify both approaches simply as “Embedded”. This conflation reveals a critical gap: spatial proximity, i.e., merely placing a visualization near its referent, is insufficient to ensure it seamlessly integrates with the surrounding environment.
To address these limitations, we propose a theoretical lens capable of articulating this quality of integration: diegesis [9, 36, 59]. Borrowed from narratology and game design, diegesis describes the extent to which an element is perceived as native to its narrative world. When applied to AR-based SV, it measures the degree to which a visualization appears as an intrinsic part of the physical environment rather than a superimposed artifact [64, 86]. This perspective moves beyond simple spatial relationships, offering a richer vocabulary for assessing how a visualization’s form, behavior, and context contribute to its sense of belonging. While diegesis is widely applied in media and game design, it has received only tangential discussion in situated visualization [86]. This oversight is surprising, given the relevance of storytelling to data visualization.
While prior work has introduced diegesis conceptually [9, 36, 47, 59], the field lacks a mechanism to systematically compare the extent to which different situated AR visualizations ‘belong’ in their environment. In this paper, we formalize this concept through the SCORE framework, a tool designed to quantify diegesis in Augmented Reality-Based Situated Visualization. Our goal is therefore not only to define diegesis, but to operationalize it into an analytical framework. This quantification enables researchers to: (1) profile existing designs along consistent dimensions; (2) compare designs that prior frameworks treated as identical; and (3) identify clusters to recognize under-explored areas of the design space. Instead of categorizing a visualization through binary labels (e.g., fully vs. non-diegetic), quantification places it on a spectrum. For instance, as shown in Figure 2b-c, the abstract sphere overlay (SCORE 0.97) is quantitatively less diegetic than the virtual smoke integration (SCORE 4.35), despite both representing air quality data in the same physical space. This granularity allows designers to reason precisely about how specific dimensions influence the seamless integration of virtual objects into the physical environment. Importantly, this quantification is not intended as a normative metric where a higher value strictly equates to a ‘better’ visualization. Instead, the framework serves as an analytical lens, enabling researchers to quantify diegesis in order to reason about the necessary trade-offs between immersion, intuitiveness, and information bandwidth.
Grounded in a structured analysis of 50 contemporary Situated Visualization (SV) works, our framework assesses diegetic integration across five dimensions that form its acronym: Spatial Proximity, Concreteness, cOherence, Referential Context, and Environmental Context. We validate the descriptive power of the framework through a user study (N = 21), which confirms high inter-rater reliability. Furthermore, a subsequent cluster analysis identifies five distinct design categories, providing a new vocabulary for comparing situated visualizations based on their level of diegesis. Our primary contributions include:
- SCORE framework: A data-driven tool for quantifying diegesis that offers researchers and designers to analyze, compare, and reason about diegetic design choices in AR-based SV.
- Empirical validation: A user study (N = 21) demonstrated high inter-rater consistency, confirming the framework’s reliability as well as its descriptive and comparative value.
- Design Archetypes: A data-driven taxonomy of five distinct categories of situated visualization, providing a structured vocabulary for characterizing and navigating the diegetic design space.
2Background
In this section, we summarize the background literature on situated visualization and relevant work on diegesis. We then outline the gaps in existing frameworks that are addressed through this work.
2.1Situated Visualization
Fitzmaurice et al. [31] introduced the term Spatially Situated Information Spaces to describe the placement of contextually relevant digital information in our 3D environment. Later, White and Feiner [81] coined the term Situated Visualization (SV) to define data visualizations that are tightly coupled with the physical environment. Building further on this concept, Willett et al. [82] formalized the notion of a visualization’s connection to its physical referent– a physical space, object, or entity in the environment to which the visualization explicitly relates. Their framework distinguished SV from Embedded Visualization, based on the degree of spatial indirection, or inversely spatial proximity, between the visualization and its physical data referent. They define embedded visualization as a subcategory of situated visualization, where the visualization is directly overlaid or integrated with the referent. Recent work from Lee et al. [49] identified a set of common design patterns applied in SVs, with which we compare our framework in section 4.5. Other researchers have noted that it is not only the spatial positioning of a visualization that makes it “situated”; one may also consider contextual relevance of the user’s activity or other factors [8, 29]. For instance, Bressa et al. [8] broadened the scope of context to include time, culture, and activity. This richer understanding of context has pushed the field towards more interactive paradigms. For instance, Situated Analytics (SA) extends SV by integrating robust interaction and sensemaking support, bringing it closer to the goals of Immersive Analytics [70, 78]. To provide a sufficiently broad scope for this work, we use a somewhat extensive definition of SV, meaning that it features a clear physical referent and is deliberately designed for both context-awareness and physical integration.
Our approach to data integration in situated visualizations similarly embraces a broad definition of data visualization, drawing from established frameworks [54]. We consider it as the encoding of one or more data variables (e.g., position, direction, or attributes) through visual marks and channels to facilitate cognition and decision-making. This inclusive perspective encompasses spatial guidance (SG) cues that encode navigational or environmental data, e.g., AR cues that depict distance and direction relative to physical referents (as illustrated in Figures depicting shadows in Figure 7f). For the purposes of this work, we consider spatial guidance cues to be “data visualization”. While this may contrast with the common vernacular usage of the term, the graphical depiction of spatial information technically fits the definition given by Tableau [75]: “Data visualization is the graphical representation of information and data.” Although certain prior models differentiate spatial guidance from “pure” data visualization [82], we incorporate them as they exemplify SV principles: tight coupling with contexts. To precisely scope our analysis within the broad landscape of situated visualization and situated analytics, we adopt the following definition drawn from the foundational literature [8, 26, 28, 49, 70, 81, 82]: “Situated visualization is an in-situ visual encoding of one or more data variables about a physical referent (object, space, or phenomenon), spatially co-located with — or explicitly anchored to — that referent, and contextually aligned with it.”
This inclusive approach enables our framework to quantify diegesis across hybrid designs, revealing trade-offs tied to visualization bandwidth [28]. For instance, an AR arrow that encodes solely direction (one variable) may be perceived as diegetic if it integrates seamlessly with its environment. Adding variables like size (distance) or color to signal conditions (e.g., red hazards, green safety) increases bandwidth but reduces perceived integration. Assessing designs irrespective of variable count, our collection uncovers patterns significant to immersive environments.
2.2Prior SV Models: Where SCORE Fits
Several rigorous frameworks [8, 26, 49, 70, 81, 82] have been established to characterize Situated Visualization (SV) and Situated Analytics (SA). While these contributions have advanced the field, they primarily focus on the spatial positioning of visualizations relative to their physical referents. To recapitulate the previous section, foundational work, such as that by White and Feiner [81] and Willett et al. [82], defined situatedness primarily through the lens of spatial indirection, that is, how closely a visualization is registered to its referent object. However, subsequent research by Bressa et al. [8] expanded this view, arguing that situatedness is not solely about spatial placement but also about context, specifically how well a visualization semantically aligns with the culture, time, and activity of its environment. In this work, we use context in this broader sense, referring to the semantic relationship between a visualization and its physical setting, including both the physical objects to which it relates (e.g., the referent) and the surrounding environment in which those objects appear.
To theoretically ground this definition, we align with Dourish’s [25] distinction between interactional and representational context. While we acknowledge that context can be viewed as a fluid property that emerges through interaction, establishing a quantifiable framework requires a more structured approach.Therefore, SCORE explicitly adopts a representational view, treating context as delineable and stable information independent of the activity. Guided by this lens, SCORE synthesizes these evolving perspectives by deconstructing spatial positioning [49, 70, 82] from semantic alignment [8, 29, 53, 79]. This distinction allows us to isolate distinct measurable variables: Spatial Proximity, alongside Referential Context (semantic alignment with the specific referent) and Environmental Context (alignment with the broader surroundings).
To ensure terminological precision, we align with the hierarchical taxonomy established by Willett et al. [82]. In this framework, situated visualization serves as an umbrella term for visualizations that are spatially and semantically related to their physical surroundings, while embedded visualization denotes a specific subcategory where visualizations are physically co-located with their referents. While recent literature often uses “situated” broadly to refer to AR-based implementations [8, 49], we adhere to the hierarchical view in which embedded visualizations are treated as a specialized type of situated visualization. Consequently, when AR systems such as SiteLens [81] are described as both “situated” and “embedded,” this is not a contradiction; it reflects a shift in granularity between the broader category and its specific subtype. In this paper, we adopt this convention: “situated” refers to the broader domain of context-aware AR visualizations, while “embedded” is reserved for those anchored tightly to a specific physical referent.
Our framework offers a more holistic perspective on information visualization within AR interfaces, as illustrated in the Venn diagram in Figure 2a. The diagram encapsulates various visualization techniques that share the core premise of SV: placing information in situ, near the physical referent where it matters most. Within this broad scope of in-situ visualizations, we position Situated Visualization as a subset requiring a semantic link to a referent [49, 81, 82], with Embedded Visualization nested inside as a subcategory defined by closer spatial proximity [82]. We intersect these with Concrete Scale Visualization [18] to demonstrate that design strategies can transcend spatial boundaries. While concrete scales are often situated (e.g., virtual sugar cubes beside juice), they can also function without a physical referent (non-situated).
The horizontal diegetic axis provides a complementary lens that cuts across these categories, measuring the degree to which a visualization appears to belong to its environment. This implies that categories such as embedded or situated visualization can range from non-diegetic to diegetic, depending on how seamlessly they blend with the surrounding narrative. Moreover, we offer this lens to help the domain move beyond simple spatial placement, enabling the design of visualizations that feel like an intrinsic part of the real-world environment. For example, consider again White and Feiner’s visualization [81] of carbon monoxide (CO) levels in the air, depicted either as spheres (Figure 2b) or as smoke (Figure 2c). Existing frameworks, including Willett’s, classify both visualizations equivalently as instances of embedded visualization. However, from the diegesis perspective, one visualization is more diegetic than the other. The question then arises, how do we clearly differentiate and describe such cases? In answer, we present our SCORE framework to thoroughly explore and quantify the concept of diegesis, discuss how it can be effectively leveraged in SV, and identify key factors researchers and designers should consider when incorporating diegetic elements into their spatially situated visualizations.
2.3Landscape of Diegesis
The term diegesis has been widely used in narratology and media theory [9, 35, 83] and has been defined as “what relates, or belongs, to the story,” i.e. the content of the narrative world itself [36]. For instance, in film, elements perceived by the characters, such as radio sounds or environmental signage, are diegetic, whereas components like background music or an omniscient narrator’s voice are considered non-diegetic as they lie outside the characters’ reality [30]. Beyond literature and film, the concept evolved in video game design, especially in redesigning the UI elements [46, 47, 52, 61, 65, 68]. In their work, Fagerholt et al. [30] formalized the concept of diegetic UI elements, which exist within the game’s fictional world (the player’s character can theoretically see or hear them), whereas non-diegetic elements remain outside the game’s narrative. This concept is quite popular in game design such that manypopular games apply this concept of diegesis [1, 20, 21].
In addition to gaming in immersive interfaces, the notion of diegesis has been explored across diverse contexts within AR, VR, and MR environments [47, 48, 50, 61, 68, 80]. These range from cinematic VR [56, 66], data visualization [48, 80] and spatial guidance cues [36, 59, 64] to more intuitive information displays[13]. Compared to VR, where the environment is fully virtual, diegesis in AR presents unique challenges due to the need to blend virtual elements with the physical world. Specifically, AR literature emphasizes the seamless integration of virtual objects into the physical world [55, 64], highlighting metaphorical coherence rather than prioritizing visual fidelity or rendering quality.
The principle of SV (presenting data in context, in place) is closely aligned with the concept of diegesis [86]. Likewise, numerous SV examples [13, 17, 62, 68, 81] align closely with the concept of diegesis, such as the smoke visualization used in Sitelens [81], where the virtual smoke becomes seamlessly integrated into the urban environment. While this connection has been acknowledged, SV literature offers relatively few explicit references to diegesis, tending to focus on spatial alignment and contextual relevance rather than narrative or real-world consistency. Prior research demonstrates that diegetic approaches can enhance user engagement and foster a greater sense of presence in immersive interfaces like AR or VR [36, 59, 68], and has been widely applied in the gaming domain [61]. However, a comprehensive investigation that tailors diegesis specifically to SV remains underexplored. In this work, we rigorously examine diegesis from an SV perspective. We clarify the intersection between SV and diegesis and investigate how diegetic principles can be leveraged to create more intuitive and engaging situated visualizations.
2.4Characteristics of Diegesis
In immersive environments, diegesis refers to the extent to which a visualization is integrated into the narrative world, appearing as a natural part of the environment rather than a superimposed overlay [4, 59, 64]. For example, the smoke-based visualization is highly diegetic, as it behaves like a plausible atmospheric phenomenon within the street scene, whereas the abstract sphere representation is non-diegetic, perceived as an artificial overlay detached from the world (Figure 2 b-c). Drawing upon the widely accepted definition of diegesis from existing literature [36, 56, 59, 61, 68], we identified the following characteristics that consistently emerge across diegetic visualizations:
- Visual Resemblance: This refers to how closely a virtual object mimics its expected real-world counterpart in a given context [36, 59]. High visual resemblance ensures that a visualization is perceived as a plausible part of the physical environment. For example, virtual furniture that matches the expected shape, scale, texture, and shading of real furniture (Figure 5d) reinforces the user’s sense of spatial presence.
- Spatial Integration: Describes how naturally a visualization fits within its environment. It focuses on where an element is placed and whether that placement is appropriate for the setting and task, in contrast to visual resemblance, which concerns how it looks. A visualization with strong spatial integration is positioned in a manner that is contextually, functionally, and perceptually coherent. Concrete visualizations (e.g., sugar cubes on a table; Figure 1a) must adhere to positional expectations and physical laws, while abstract ones (e.g., text annotations) benefit from direct embedding into referents (Figure 6b) or anchoring to nearby elements (Figure 5b).
- Internal Consistency: Internal consistency refers to the degree to which a visualization’s appearance and behavior align with users’ mental models [36, 58, 59]. Unlike visual resemblance or spatial integration, which assess how the visualization looks or where it is placed, internal consistency evaluates whether the visualization feels plausible in practice. Even minor deviations can disrupt this alignment and weaken diegesis. For example, in Figure 7g, virtual fruits resemble their real counterparts and are placed on a table, yet their atypical arrangement conflicts with expectations of how fruits are normally displayed. Similarly, a virtual keyboard may closely mimic its physical form but lose consistency if exaggerated key heights undermine users’ sense of realism and immersion (Figure 1c).
While existing frameworks provide essential taxonomies for SV based on placement [49, 70, 82] and context [8, 53, 79], they largely overlook how well a visualization is integrated with its physical environment; as a result, experientially distinct designs that feel “of the world” are treated as theoretically equivalent. We argue that diegesis offers the missing construct, which remains overlooked in SV. Furthermore, the roles of visual and behavioral realism remain largely unexplored in SV designs. The SCORE framework is therefore introduced as a systematic tool to formalize the concept of diegesis in SV, providing a quantitative basis for analysis and a structured vocabulary to profile and compare visualizations based on their level of diegesis.
3SCORE Framework
In this section, we present an in-depth analysis of the SCORE framework. We begin by describing our survey methodology, outlining how we constructed a corpus of 50 papers for a systematic analysis of diegesis in situated visualizations. We then explain how the SCORE dimensions were derived from prior literature and formalized into scales that quantify each dimension. Subsequently, we calibrate these scales using data-driven weights. Finally, we apply the framework by scoring representative examples from our corpus.
3.1Survey Methodology
The development of the SCORE framework was grounded in a close analysis of existing visualization designs, with the goal of identifying emerging patterns related to diegesis in Augmented Reality-Based Situated Visualization (SV) research. While the use of environmental elements to represent data is a common and intuitive strategy within SV [17, 81, 82], the term diegesis itself is rarely employed in this context. To bridge this gap, our survey examined how diegetic principles appear in immersive visualization environments, regardless of explicit terminology. We followed a structured, multi-step paper selection process to ensure comprehensive coverage, enabling us to analyze both conceptual foundations and design implementations. This revealed recurring use cases and design strategies across the literature.
3.1.1Keyword Search and Scope
We utilized a snowballing-based literature review methodology [15, 77, 84] to conduct a structured search, a standard approach in HCI for constructing design spaces, employing both backward and forward citation chasing. Our process began with an initial keyword search across the ACM Digital Library and IEEE Xplore, utilizing both full and abbreviated forms related to situated and embedded visualization, as well as immersive platforms (e.g., AR, VR, MR). An example advanced search query from the ACM Digital Library illustrates our approach.
Query: { ("Situated Visualization"; "Embedded Visualization"; "Situated Analytics"; "In-situ Visualization"; "Diegetic Visualization"; "Immersive Analytics"; "situated"; "embedded"; "in-situ"; "diegetic"; "diegesis")
AND
("AR"; "Augmented Reality"; "VR"; "Virtual Reality"; "MR"; "Mixed Reality")
Filter: {Publication Date: (01/01/2018 TO 01/31/2025)} }
In addition to digital libraries, targeted searches were performed across notable conferences and publication venues known for their relevance to Human-Computer Interaction (HCI) and visualization research, including IEEE VIS, ACM CHI, ACM AVI, ACM VRST, IEEE ISMAR, IEEE GEM, and ACM DIS. The initial keyword-based search resulted in 431 candidate papers. Additionally, the references of recent relevant publications were reviewed to identify significant papers potentially overlooked. The authors’ expertise further supplemented the selection for comprehensive coverage.
Our analysis deliberately focuses on Augmented Reality (AR), as it is the predominant modality for research on SV [8, 49, 69]. This scoping decision is critical for the framework’s precision. AR-based SV involves superimposing digital information directly onto a user’s view of the physical world. This creates a unique design context where the meaning of a visualization is deeply intertwined with its real-world referent. Our goal is to develop a framework that specifically addresses the challenges of this direct digital overlay, particularly how the virtual-physical boundary influences a visualization’s perceived role as an environmental element (i.e., its level of diegesis) and how this, in turn, impacts other dimensions of diegesis.
Consequently, we excluded data physicalizations from our corpus. While physicalizations are a valid form of SV [8, 82], they differ fundamentally from AR overlays. Physicalizations are governed by the laws of physics and materiality; their form, texture, and behavior are inherently grounded in the real world. In contrast, AR visualizations are digital, allowing them to possess properties impossible for physical objects (e.g., transparency, implausible behavior). A framework designed for digital overlays would not adequately capture the unique design constraints of tangible, physical artifacts. This distinction helps maintain the framework’s focus.
While our search included Virtual Reality (VR), the resulting framework is primarily tailored to AR. We retained VR examples only when they strictly aligned with our definition of SV (see Section 2.1), specifically by being anchored in close proximity to a virtual referent [13, 68]. However, in a VR environment, the distinction between a data representation and a virtual object can become blurred, altering the nature of situatedness. By focusing on AR, we ground our framework in scenarios where the physical environment is an active and inseparable component of the visualization. Acknowledging this scope, we propose that adapting the framework for broader VR use cases and physicalizations is a valuable direction for future work, which could extend its utility across the full physical-virtual continuum.
We conducted a preliminary filtering using the following inclusion criteria:
- Visualizations must be in-situ (Positioned within the physical context of the data referent or relevant environment).
- Visualizations convey information directly pertinent to their real-world referent or context.
- Visualizations do not require substantial interactive exploration or intensive analytical reasoning.
- Platforms are explicitly AR, MR, or VR.
After applying the inclusion criteria, our selection resulted in 50 papers. In several cases, we included multiple visualization examples from a single source when they demonstrated clearly distinct diegetic characteristics. For instance, in SiteLens [81] (Figure 2b-c), we retained both the smoke and sphere visualizations, as each offered unique design properties. This resulted in a final corpus of 67 distinct examples. To ensure consistency, all authors participated in a series of collaborative review sessions, approximately five bi-weekly sessions over three months, including consensus discussions with the two senior co-authors, both of whom have over 15 years of experience in visualization and HCI domain. This process ensured that the corpus reflects a diverse yet coherent range of design strategies relevant to our analysis.

3.2Grounding SCORE Framework
The SCORE framework is built upon a systematic synthesis of diegesis and Situated Visualization (SV) to create a unified model for quantifying a visualization’s seamless integration into the physical world. Our derivation began with foundational concepts, including diegesis, which encompasses three qualities: Visual Resemblance, Spatial Integration, and Internal Consistency (Section 2.4). In parallel, situatedness assesses a visualization’s alignment with its physical referent and its surrounding environment (Section 2.1). The third key concept is Concreteness, a fundamental attribute that influences diegesis as well as how a visualization is perceived [18, 42].
- Spatial Proximity directly reflects the diegetic quality of Spatial Integration. As a core driver of situatedness, it measures the spatial relationship between a visualization and its referent.
- Concreteness captures Visual Resemblance by quantifying a visualization’s level of abstraction, i.e., how concrete or abstract it appears.
- Coherence formalizes Internal Consistency by assessing how well a visualization’s appearance, placement, and behavior align with users’ mental models and physical expectations.
- Referential Context and Environmental Context add necessary granularity to the broad concept of situatedness by separating contextual alignment. This distinction is critical, as a visualization can be semantically linked to its direct referent but still feel out of place in the broader environment.
Together, these five dimensions: Spatial Proximity, Concreteness, cOherence, Referential Context, and Environmental Context — form the SCORE framework. This framework was derived through a rigorous, iterative process (N=7 sessions among the authors) during which foundational concepts were discussed and potential dimensions were scrutinized for their theoretical grounding and orthogonality. This refinement led to key structural decisions, such as separating an initial singular dimension for “context” into “Referential” and “Environmental” to achieve greater analytical precision. To summarize, this grounding process involved:
3.3SCORE Scale
A central choice in SCORE is to model each dimension of diegesis as a continuum rather than a binary label. This framing allows for a more detailed assessment, capturing subtle differences that discrete categories would miss. For instance, Spatial Proximity (i.e., where the visualization is positioned relative to its referent) is not simply “on” or “off” the referent; it spans a range from distant placement to full surface integration, where the visualization appears intrinsic to the object itself (e.g., Figure 4).
Each dimension is therefore assessed on an ordinal scale, where higher levels indicate stronger coupling between the visualization and its corresponding dimension of diegesis. We adopt an ordinal rather than interval or ratio scale as our goal is not to measure absolute distances but to order designs along a meaningful progression of coupling. This ordinal framing provides the necessary granularity to capture intermediate states, thus allowing us to position both unambiguous cases and designs that do not neatly fit into binary categories.
For instance, Referential Context ranges from minimal alignment (e.g., an element placed near a referent without a semantic connection) to strong alignment, where form and context reinforce each other. In Figure 1a, stacked sugar cubes encode the sugar content of a juice packet. The metaphor (i.e., sugar cubes as units of sweetness), combined with immediate adjacency, creates an intuitive mapping that enables viewers to quickly compare sweetness levels and grasp “how sweet” the juice is through this contextually grounded representation.
In the following, we discuss details on how we crafted the scales and corresponding levels for each dimension, including validation through a visualization example from the corpus.
3.3.1Spatial Proximity
Spatial Proximity defines the spatial relationship between a visualization and its corresponding referent [49, 82]. This dimension reflects the spatial integration characteristic of diegesis discussed in Section 2.4. To map Spatial Proximity onto our quantitative scale (Table 1), we build upon the foundational work of Willett et al. [82]. While their framework introduces “spatial indirection” to describe the offset between a data representation and its physical referent, translating this conceptual abstraction into a precise, measurable metric presents challenges. We therefore formalize this concept by categorizing the physical distance between the visualization and its referent into distinct levels, ranging from surface-level embedding to visualizations positioned at a considerable distance (Figure 4). This approach adds necessary granularity to the broad categories of non-situated, situated, and embedded used in prior work [8, 49, 82].
3.3.2Concreteness
Concreteness captures the degree to which a visualization preserves the recognizable structure and appearance of a real-world object. It reflects how tangible, literal, and perceptually grounded the representation is within a physical or virtual environment. Following Nieman’s definition [57], we treat concreteness as a graded scale rather than a binary distinction (Table 1). High concreteness indicates strong visual resemblance, i.e., the virtual object closely mirrors the real one in form and texture. Low concreteness corresponds to abstract or symbolic representations with minimal visual similarity to the real world. Concreteness thus captures the visual resemblance aspect of diegesis, addressing the question: To what degree does the visualization resemble a physical object?
3.3.3Coherence
In situated visualizations, coherence refers to how well a visual representation aligns with a user’s mental model by appearing logical and consistent in appearance, behavior, and placement within the real world [60, 76]. Coherence (Table 1) captures the logical and physical consistency of virtual elements within their real-world context and is strongly shaped by internal consistency (diegetic quality mentioned in Sec 2.4). Three factors contribute to coherence: (i) contextual plausibility, i.e., whether placement is logical within the real-world environment; (ii) behavioral realism, i.e., adherence to expected physical laws in dynamic properties; and (iii) visual realism, i.e., how closely appearance matches expectations for such an object. For instance, the visualization in Figure 1c shows low coherence because the exaggerated height of the virtual keyboard keys conflicts with a user’s mental model of a physical keyboard.
3.3.4Referential Context
Referential Context (Table 1) assesses the strength of the semantic link between a visualization and its direct physical referent. While foundational SV research emphasizes the importance of a visualization’s context [8, 29, 79], this dimension specifically emphasizes the relationship to the data’s source [49, 82]. A high degree of referential context is achieved when the visualization serves as a clear and meaningful proxy for the referent’s properties. This is often accomplished through strong metaphorical associations, such as using virtual sugar cubes to represent the sugar content in a juice packet (Fig. 1a), making data more visceral and interpretable. The core question for this dimension is: How clearly does the visualization relate to the object it describes?
| Lvl | Spatial Proximity | Concreteness | Coherence | Ref. Context | Env. Context |
|---|---|---|---|---|---|
| 0 | Non-situated: The visualization is not associated with any physical referent. | Symbolic Representation: Purely abstract marks with no structural mapping (text or numerals; Figs. 6b, 9b). | Incohesive: Neither resembles nor behaves like real objects, breaking expectations (Fig. 2b: colored spheres floating midair). | No alignment: No semantic link to the referent (abstract 3D object floating in space; see Fig. 2b). | No alignment: No semantic relation to the environment (floating text panel in space; Fig. 9b). |
| 1 | In-situ: Same environment as the referent but spatially distant and without an explicit link (Fig. 4a: panel far from cup). | Geometric Primitive: Basic 3D shapes with volume (colored spheres in Fig. 2b) feel more tangible than flat 2D. | Weak Cohesion: Mostly unrealistic with minimal believable cues (a virtual dome mimicking a shadow; Fig. 7f). | Ambiguous alignment: Unclear association with the referent (text panel near a stone with no explicit relation; Fig. 9b). | Ambiguous alignment: Unclear connection to the environment (3D spheres for CO levels with unclear correlation; Fig. 2b). |
| 2 | Linked: Spatially distant but explicitly connected, reducing ambiguity beyond in-situ (Figs. 4b, 1e). | Schematic Representation: Stylized depiction conveying an object’s idea without realistic structure (a virtual dome mimicking a person’s shadow; Fig. 7f). | Partial Cohesion: Initially unrealistic but includes plausible cues that afford interpretation (a floor heatmap rationalized as a spill; Fig. 7h). | Indirect alignment: Represents a property indirectly (virtual book stacks encoding seat information rather than reading data; Fig. 5c). | Indirect alignment: Relates indirectly to the environment’s function (virtual water bottle in a washroom to represent water per flush; Fig. 7e). |
| 3 | Situated: Placed adjacent to the referent, clarifying association and typically avoiding occlusion (Figs. 4c, 1a). | Simplified Replica: Recognizable geometry with limited detail or texture (AR roadwork signs; Fig. 7d). | Moderate Cohesion: Generally consistent, but close inspection reveals discrepancies (virtual keyboard with exaggerated key heights; Fig. 1c). | Clear alignment: Serves as a clear proxy (virtual shadow attached to a person; Fig. 7f). | Clear alignment: Fits the environment but remains an obvious proxy (virtual shadow outdoors; Fig. 7f). |
| 4 | Overlaid: Positioned directly over the referent as a hovering layer, often causing occlusion (Figs. 4d, 8b–d). | Detailed Replica: Closely approximates real objects with minor texture/shape imperfections (virtual keyboard; Fig. 1c). | Strong Cohesion: Largely consistent with expectations; minor flaws remain (cohesive virtual fruits despite an unconventional arrangement; Fig. 7g). | Meaningful alignment: Meaningful/metaphorical link to the referent (virtual sugar cubes for sugar content; Fig. 1a). | Meaningful alignment: Connected to the environment yet visually distinct (AR roadwork signs; Fig. 7d). |
| 5 | Embedded: Perfect 1:1 alignment with the referent, giving an immediate, unambiguous association (Figs. 4e, 1b). | Realistic Facsimile: Precise replication of shape, texture, and features (virtual furniture; Fig. 5d). | Cohesive: Fully logical and realistic, matching real-world appearance/behavior (virtual furniture; Fig. 5d). | Inseparable alignment: Directly modifies the referent’s appearance (color overlay altering facial features; Fig. 8b (right)). | Inseparable alignment: Seamlessly part of the scene (virtual furniture; Fig. 5d). |
3.3.5Environmental Context
Environmental Context (Table 1) evaluates a visualization’s conceptual alignment with the broader physical environment in which it appears. A visualization can be referentially clear yet environmentally incoherent, disrupting diegesis. For example, a virtual glass of milk displayed in a dairy aisle (Fig. 7b) has a clear referential link to the milk carton but is environmentally inappropriate, as one would not expect to see a floating glass of milk in that setting. This distinction is critical for our framework, as it allows us to pinpoint design patterns that create strong diegetic integration. A recurring challenge in assessing Environmental Context is that visualizations in the source literature are often depicted in tightly cropped images, obscuring their physical surroundings (Fig. 7g, 8b). To address this ambiguity, we assess this dimension using a principle of plausible placement. We evaluate a visualization’s appropriateness within its referent’s most probable real-world setting, even if that setting is not explicitly shown. For instance, the sugar cube visualization (Fig. 1a) is assessed based on its conceptual fit within an inferred kitchen or café environment. Therefore, our guiding question is: To what extent is the visualization conceptually aligned with the referent’s most probable real-world setting?
3.4SCORE Validation–Inter-Rater Reliability
To quantify diegesis within the SCORE framework, we developed a rubric structured from the scales in Table 1, providing representative examples for each level to ensure consistent application (Provided as supplementary materials). We validated this rubric’s reliability and descriptive validity, i.e., its consistent interpretation among raters, through a user study.
3.4.1Participants
We recruited 21 participants (8 female, 13 male; M = 26.9, SD = 2.67) with expertise in immersive analytics and visualization. To ensure a high degree of domain knowledge, a key inclusion criterion was a minimum of three years of experience working with AR/VR systems. Participants were recruited via email lists, posters, and social media. All recruited participants were Computer Science graduates and possessed research experience in HCI, immersive technologies, and visualization design. All study procedures were approved by our Institutional Review Board (IRB), and each participant received a $25 gift card as compensation.
3.4.2Procedure
The study’s objective was to assess the inter-rater reliability of the five-dimensional SCORE Scale using a counterbalanced, within-subjects design. The 90-minute sessions were conducted in small groups (2–3 participants) and facilitated by a researcher to encourage a think-aloud style of discussion. Based on a pilot study, we observed that participants could comfortably evaluate approximately 20 visualization examples within the allotted session time. To ensure the sample was representative and free from selection bias, we randomly drew 20 example images from our full corpus of 67 visualizations. The core task involved participants evaluating these 20 visualizations across the five SCORE dimensions. To mitigate order effects, the sequence in which the dimensions were presented was randomly selected for each group.
Each session followed a “rate-discuss-rate” protocol to capture both initial and considered judgments. The session began with a training module where the facilitator introduced the SCORE rubric and the group collaboratively rated five practice examples to establish a shared interpretive baseline. For the remaining visualizations, participants first submitted a private, individual rating. They then engaged in a group discussion about their rationales before submitting a final, revised individual rating. This protocol provided a robust dataset for our mixed-methods analysis.
3.4.3Results and Findings
Inter-rater reliability, measured with Krippendorff’s alpha (α), was high across all five dimensions (α > .80), confirming the scale’s robustness. Dimensions tied to directly observable properties achieved the highest levels of agreement: Concreteness (α = .926), Coherence (α = .899), and Spatial Proximity (α = .884). In contrast, the more interpretive dimensions of Referential Context (α = .845) and Environmental Context (α = .815) yielded slightly lower, yet still strong, alpha values. This result validates the scale while also reflecting the inherent subjectivity involved in assessing contextual relationships.
Analysis of the discussion transcripts enabled us to move beyond considering if raters agreed, to understand why they sometimes diverged. We identified three recurring themes that highlight key cognitive and perceptual factors in assessing situated visualizations. The primary findings for each SCORE dimension are as follows:
- S:Raters consistently evaluated a visualization’s spatial proximity relative to the physical object it was attached to, even if that object was not the actual referent. For instance, when a visualization about a general “cooking context” was attached to a refrigerator (Figure 5b), participants often considered the refrigerator as the referent, showing a tendency to link data to the nearest tangible object.
- C:A visualization’s perceived concreteness was driven more by its conceptual connection than by graphical fidelity. For example, participants gave high ratings to designs physically attached to real objects (e.g., graphics on a newspaper in Figure 1b), even when the visual encoding was abstract, or to designs employing strong metaphors (e.g., a virtual road sign in Figure 7d). This demonstrates that a strong conceptual link can override graphical simplicity.
- O:Behavioral plausibility proved more influential than visual style when participants judged coherence. For example, a floating milk glass in a dairy aisle (Figure 7b) was rated as incoherent due to its implausible behavior, i.e., floating midair, rather than its cartoonish appearance. In contrast, a simple sticky note on a refrigerator (Figure 5b) was seen as highly coherent because its placement aligned with real-world norms.
- R:Disagreements often arose when the referent was an abstract location rather than a physical object. For instance, when colored spheres represented air quality at a specific geospatial coordinate (Figure 2b), raters tended to assess their relevance against the broader visible location (e.g., the street) rather than the invisible coordinate, leading to varied interpretations of alignment.
- E:A visualization’s environmental context often depended on how users interpreted its surroundings. For example, a 2D panel on a hive box was viewed by some as a plausible poster, but by others as a distracting digital overlay (Figure 6d). Likewise, a 3D molecule representing CO data (Figure 2b) was interpreted by some participants as dust in the air, while others perceived it as an abstract overlay, resulting in substantial variance in ratings.
3.5Scoring the Visualization Corpus
Building upon the demonstrated reliability of the SCORE scales, we systematically scored the entire corpus of 67 visualization examples. To ensure methodological rigor, we implemented a two-phase protocol that combined expert coding with team-based verification.
In the first phase, the first author, who possesses deep familiarity with the framework’s conceptual levels, conducted a comprehensive initial coding of all 67 examples. This step ensured a consistent interpretation of the rubric was applied across the diverse corpus, establishing a thorough baseline for review. Subsequently, this complete set of scores was subjected to a rigorous verification process by two senior co-authors (tenured faculty members at the local university with over 15 years of research and teaching experience in Human–Computer Interaction, Information Visualization, and immersive technologies). During a series of consensus meetings, each score was systematically reviewed, discussed, and refined until the team reached a unanimous agreement for every data point.
This two-phase approach leverages the validated consistency of the rubric while incorporating team-based verification to mitigate individual bias and ensure the final dataset reflects a shared, systematic interpretation. This systematic process yielded a robust dataset for the subsequent Principal Component Analysis (Section 3.6) and cluster analysis (Section 4).
3.6Formulating SCORE
Our goal is to move beyond binary classifications (e.g., “diegetic” vs. “non-diegetic”) toward a composite index that quantifies diegetic integration on a continuum. However, a simple unweighted sum of the five dimensions would be insufficient, as it assumes all dimensions contribute equally to the diegetic experience. To reflect the actual empirical structure of the design space, we utilized principal component analysis (PCA) [43] on our corpus of 67 visualizations to uncover latent patterns of co-variation and derive data-driven weights.
| S | C | O | R | E | |
|---|---|---|---|---|---|
| S | 1.00 | 0.00 | 0.34 | 0.54 | 0.30 |
| C | 0.00 | 1.00 | 0.35 | 0.04 | 0.41 |
| O | 0.34 | 0.35 | 1.00 | 0.49 | 0.90 |
| R | 0.54 | 0.04 | 0.49 | 1.00 | 0.50 |
| E | 0.30 | 0.41 | 0.90 | 0.50 | 1.00 |
The correlation matrix (Table 2) reveals a positive correlation between Coherence and Environmental Context (r = 0.90). While this suggests that visualizations appearing physically plausible are often also semantically aligned with their surrounding environment, it raises the question of whether these concepts are redundant. Importantly, statistical correlation does not imply conceptual identity because these dimensions assess essentially distinct aspects of immersion that can be distinguished by contrasting scenarios. Consider a scenario where a virtual cup of coffee is placed on a café table. The object fits the semantic setting perfectly (High Environmental Context), but if the liquid inside is a glowing neon blue, it violates our mental model of the object’s color itself (Low Coherence). Conversely, consider another scenario where a hyper-realistic bottle of maple syrup is placed on a library desk. Although the object is rendered with high fidelity (High Coherence), it is not semantically consistent with the library setting (Low Environmental Context). These counterexamples demonstrate that while effective designs often maximize both physical plausibility and semantic alignment with the environment, they remain distinct constructs.
| S | C | O | R | E | Var. | |
|---|---|---|---|---|---|---|
| PC1 | 0.179 | 0.302 | 0.588 | 0.284 | 0.671 | 61% |
The PCA results (Table 3) confirm that these two dimensions are the primary drivers of diegesis. The first principal component (PC1) accounts for 61% of the total variance, heavily loading on Coherence and Environmental Context. This suggests they act as the pillars of diegetic design. Following a standard statistical approach to composite indicator construction [14, 16], we utilize the PC1 loadings to weight our final index. This ensures the metric prioritizes the dimensions most central to the construct, rather than assigning arbitrary equality. Based on these loadings, the final SCORE formula is defined as:
The PCA-derived weight vector, wPCA = [0.09, 0.15, 0.29, 0.14, 0.33], which gives the final formula:
Given the size and composition of our corpus (N = 67), these patterns and the resulting weights should be interpreted as corpus-specific and exploratory rather than definitive. We therefore treat the PCA-derived weights as a first, data-driven approximation of how the five dimensions co-vary in SV practice, serving as a preliminary reference that future work can refine on larger or more diverse datasets.
4Cluster Analysis
4.1Methodology
To identify higher-level patterns of diegetic design in situated visualization, we performed a cluster analysis on the dataset from our SCORE assessment of 67 SV examples. This data-driven analysis aimed to uncover recurring combinations of the five SCORE dimensions, thereby revealing distinct categories of diegetic visualization.
Our methodology involved three stages. First, we normalized the ratings for each of the five SCORE dimensions using a z-score transformation. Although all dimensions were rated on a 0–5 scale, this step was necessary to correct for differences in variance observed in our corpus, ensuring each dimension contributed equally to the subsequent analysis. Second, we performed dimensionality reduction using UMAP (n_neighbors = 12, min_dist = 0.1). We chose this method, inspired by recent work [70], to preserve the data’s local and global structure when projecting it into a lower-dimensional space. The final stage was to select the optimal number of clusters (k). We combined standard cluster validity measures (Silhouette [67], Calinski-Harabasz [12], Davies-Bouldin [22]) with a qualitative review of the resulting groups. This approach produced interpretable clusters that underpin the subsequent analysis.
4.2Categories of Diegetic Situated Visualization
Our clustering method resulted in five distinct categories of diegesis for SV, named according to their prominent characteristics: 1) Contextual, 2) Integrated, 3) Hypernatural, 4) Superimposed, and 5) Proximal. In addition to providing qualitative descriptions, the SCORE framework allows us to rank these according to their overall diegesis value. In this section, we highlight each category in detail and discuss how each dimension of the SCORE framework contributes to its formation. Additionally, to identify underlying patterns within each category, we examined how supplementary factors, such as the number of variables represented, the types of visual elements employed (Dimension including Size, Height or Density, Count, Color, Text, and Graphs or Charts), and the visualization type (i.e., Spatial Guidance vs. Data Visualization), influenced the overall cluster formation. For each category, we include an accompanying figure containing the average SCORE values and several representative examples. Examples from the subset of Spatial Guidance visualizations are labelled “SG”.
4.2.1Contextual
The Contextual category has the highest overall SCORE (M = 4.13, range = 3.46 – 5.00), reflecting a high level of diegesis (Figure 5a). Visualizations in this category exhibit the highest degree of concreteness, which provides a strong sense of physicality in the physical environment (Figure 5). They also possess relatively high levels of both referential and environmental context.
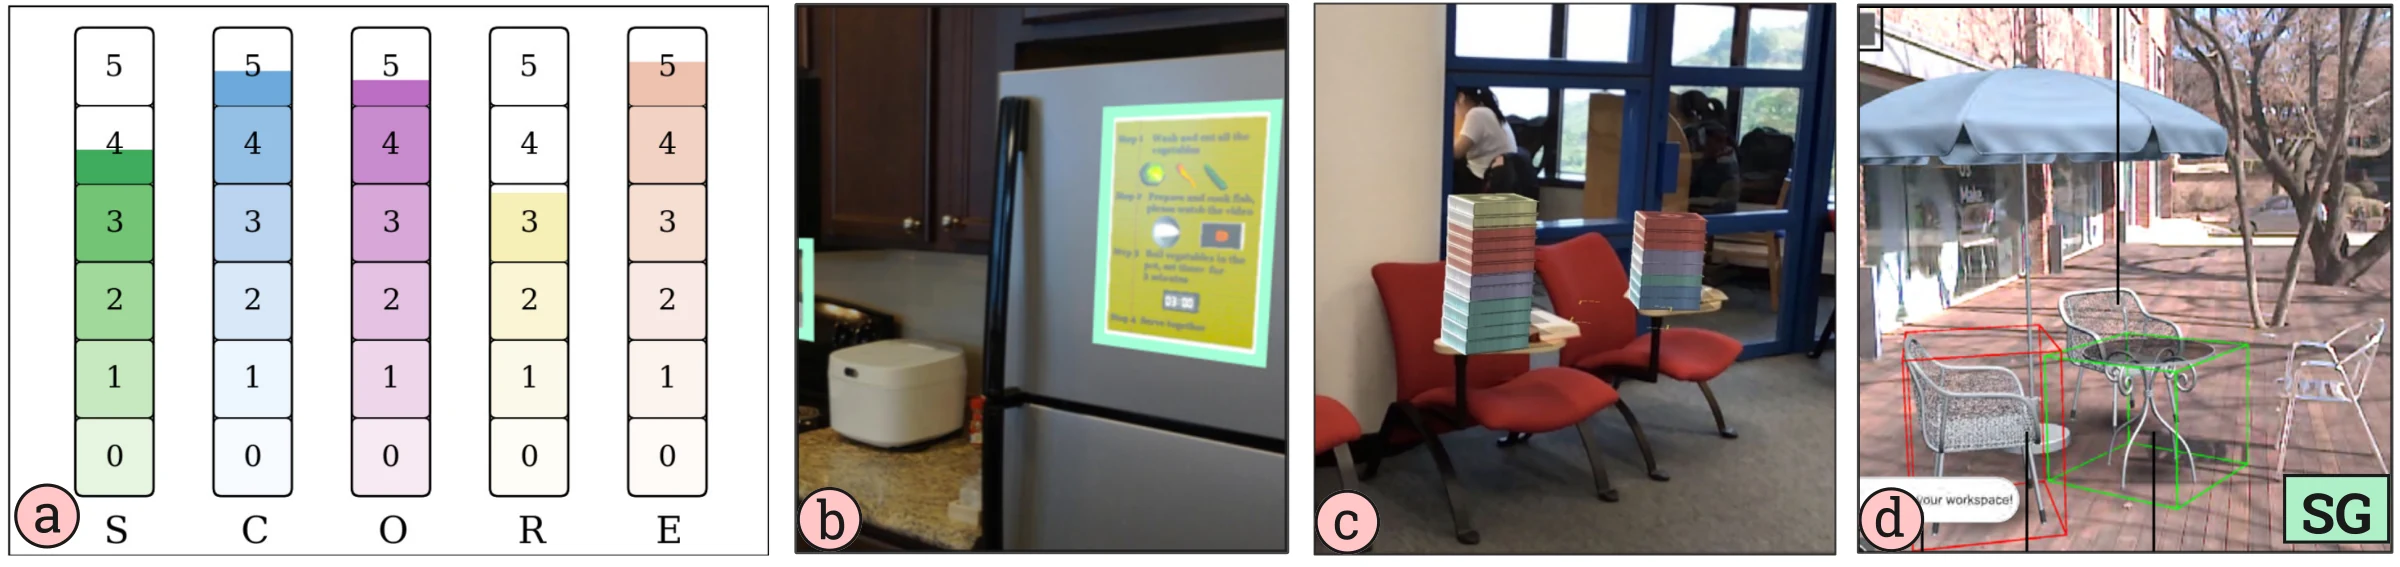
Most designs in this category leverage metaphorical or familiar visual elements to communicate information intuitively. For example, sugar cubes placed in front of a juice packet (Figure 1a) or smoke visualizations within an urban scene (Figure 2c) help viewers quickly establish meaningful connections. A few designs in this category also benefit from incorporating certain behaviors (e.g., a guide dog acknowledging the user as a diegetic navigation cue [59]) to enhance the sense of presence.
The use of abstract text is not uncommon for conveying information; however, its placement within a concrete object that belongs to the environment improves the SCORE. For instance, although text serves as the primary encoding channel in Figure 5b, it is positioned within a sticky note affixed to the refrigerator that enhances the visualization’s sense of belonging within the physical environment.
4.2.2Integrated
The Integrated category takes its name from examples where the visualization is fully integrated into the referent’s surface, typically achieving a one-to-one spatial correspondence with the physical object it represents.

This cluster (Figure 6) reveals a design pattern: perfect spatial integration can substantially enhance the diegesis of purely abstract visualizations. The strategy is reflected in a distinctive SCORE profile, characterized by near-maximal values for Spatial Proximity (M = 4.50) and Coherence (M = 4.50) and both Referential and Environmental Context (M = 4.63), while simultaneously scoring zero on Concreteness (M = 0.00). Together, these values yield a high overall SCORE (M = 3.80), demonstrating that abstract encodings can achieve strong diegesis when their placement is flawless.
4.2.3Hypernatural
The next category we call Hypernatural, borrowing from Bowman’s term for interaction beyond typical natural capabilities [6]. This category contains visual representations that deviate from users’ mental models, resulting in lower coherence.
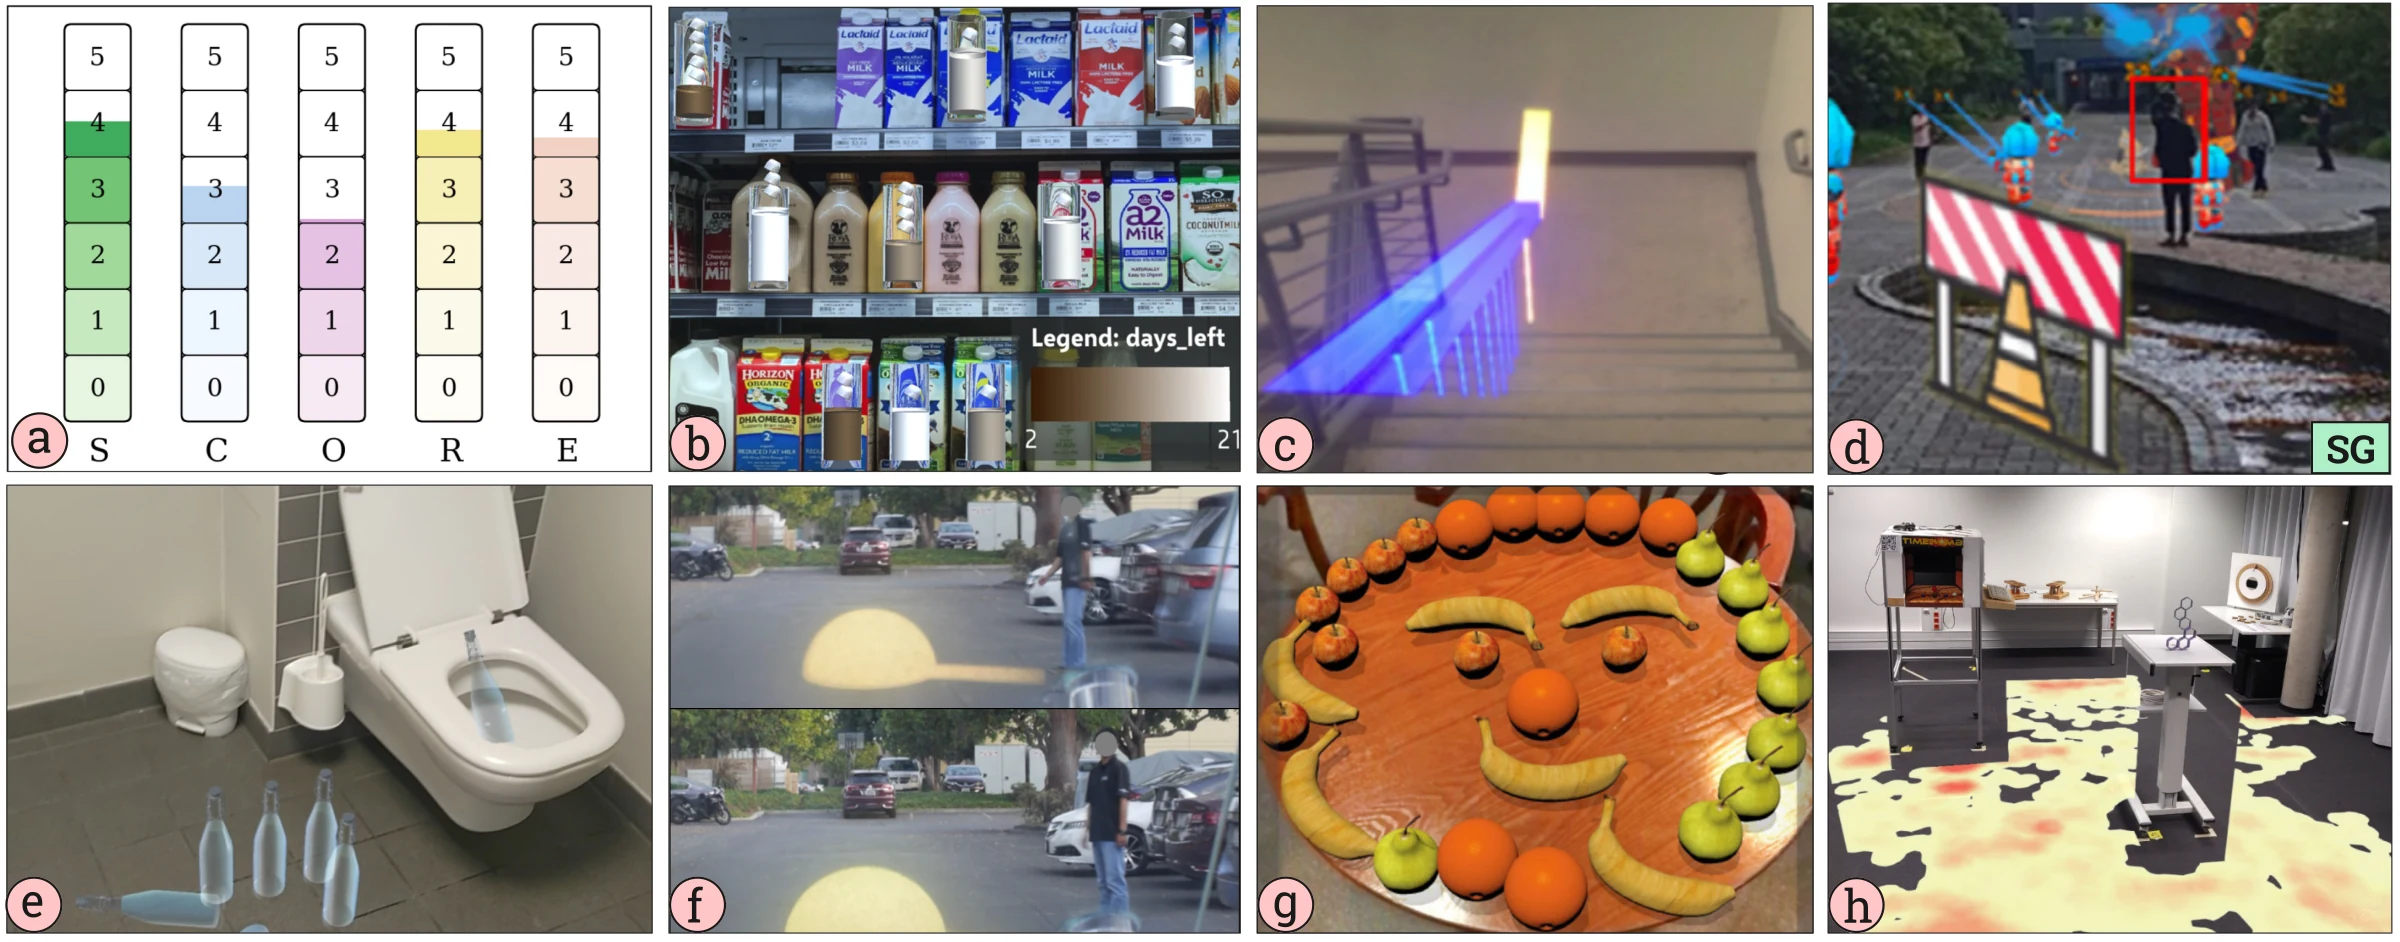
Although visualizations in this category rank highly in spatial proximity, they often lack realistic positioning, which may negatively affect immersion and coherence. Visualizations in this category often have a high spatial proximity, but do not necessarily have a strong contextual relevance. For example, in Figure 7b, the representative glass of milk is situated in front of it’s referential milk container despite the unusual presence of a glass of milk in this grocery store setting. It also appears to float in space in front of the referent, rather than sitting adjacent on the shelf.
This category also differs from the Contextual category in terms of concreteness (M = 2.6 vs 4.4). While these stylized visualizations may initially appear realistic, closer inspection reveals hypernatural elements (Figure 1c) or insufficient visual detail (Figure 7c, d), which reduce coherence. Color, dimension, and unitization are the most frequently employed visual encoding channels in this category. Given that these visualizations typically represent more variables than other categories, it necessitates the use of multiple encoding channels (Figure 7b).
4.2.4Superimposed
Visualizations in this category appear to hover or float in front of their referents, creating a sense of superimposition (Figure 8). Rather than being directly integrated into or positioned adjacent to the referent, these visualizations occupy an intermediate spatial relationship, neither fully embedded nor entirely separate. Visualizations in this category exhibit a moderate degree of concreteness (M = 0.78, range = 0–3). Often, symbolic glyphs (either 3D or 2D) are used as representations. However, these glyphs are typically not contextually meaningful in relation to their referents or surrounding environments (Figure 8d, 1d). Some 3D glyphs encode data via visual attributes like size, height, density, or color (e.g., Figures 1d and 2b), while others serve as visual glyphs providing spatial guidance (Figure 8d).

4.2.5Proximal
The Proximal category takes its name from visualizations positioned in the immediate vicinity of, or adjacent to, a physical referent. We chose this term to represent the design focus on spatial closeness, where the visualization complements the referent with additional information without directly covering it. Often, the goal is to provide supplementary data or support analytical reasoning rather than to enhance aesthetic immersion or user engagement. Consequently, visualizations in this category tend to exhibit relatively low scores across all dimensions of diegesis (see the SCORE in Figure 9).

Visualizations in this category are typically placed at a considerable spatial distance from their referents, as indicated by their spatial proximity scores (M = 2.5, range = 1–4). Due to the lack of direct adjacency between visualizations and their referents, visual links (e.g., connecting lines) are often introduced to establish a sense of connectedness (Figure 1e). However, these links can negatively impact diegesis, as they frequently appear as exaggerated overlays that do not naturally integrate into the real-world context.
Visualizations in this category are predominantly abstract, relying heavily on textual annotations, charts, and graphs to convey information (Figure 9c). Compared to other categories, visualizations in the Situated category typically encode a larger number of variables, suggesting that this pattern aligns closely with situated analytics approaches.
| Category | S | C | O | R | E | N | SCORE |
|---|---|---|---|---|---|---|---|
| Contextual | 3.33 | 4.44 | 4.33 | 2.89 | 4.56 | 9 | 4.13 |
| Integrated | 4.50 | 0.00 | 4.50 | 4.63 | 4.63 | 8 | 3.80 |
| Hypernatural | 3.53 | 2.59 | 2.06 | 3.41 | 3.29 | 17 | 2.87 |
| Superimposed | 3.86 | 0.79 | 0.64 | 3.00 | 0.50 | 14 | 1.23 |
| Proximal | 2.53 | 0.79 | 0.16 | 1.53 | 0.16 | 19 | 0.65 |
4.3Overall Trends
A side-by-side comparison of the five categories provides a comprehensive view of how diegesis varies across situated visualizations. As shown in Table 4, the overall degree of diegesis and its constituent elements vary across the clusters. Our PCA results confirm that these differences are primarily driven by Environmental Context, Coherence, and Concreteness (Table 3). This distribution supports our initial premise: all SVs contain some degree of diegesis, but the level depends significantly on the visual design strategy.
Analyzing the patterns across clusters confirms that environmental context, concreteness, and coherence significantly influence overall diegesis. For instance, the Contextual cluster, representing fully diegetic visualization, shows that achieving high diegesis requires a visualization to be concrete, coherent with the user’s mental model, and aligned with its environment. Similarly, the Integrated cluster demonstrates that strong diegesis is possible even for fully abstract visualizations (Concreteness M = 0.00), as long as they are perfectly aligned spatially with their referent. For the Hypernatural cluster, the primary factor reducing its SCORE is a notable drop in Coherence, accompanied by decreases in Concreteness and Environmental Context (Table 4). These reductions diminish the visualization’s sense of belonging within the real-world narrative, positioning it as partially diegetic.
Finally, the Superimposed and Proximal clusters primarily serve to complement the referent by providing relevant information, regardless of their spatial placement, alignment with users’ mental models, or environmental context. Due to this lack of contextual integration, these visualizations do not convincingly belong within the real-world narrative and thus fall into the non-diegetic category.
4.4Exploration of Diegetic Categories
To facilitate a more intuitive interpretation of our cluster analysis, we developed DiegeticVisExplorer1, an interactive tool for exploring the diegetic design space. The tool presents a 3D plot of our corpus, which can be rotated and filtered by cluster to examine spatial arrangements and boundaries between categories. This functionality moves beyond static clustering results by enabling users to inspect individual SV examples alongside their SCORE profiles dynamically. By linking abstract spatial representations to concrete examples, DiegeticVisExplorer1 serves as an analytical aid for developing intuition about the nuanced trade-offs inherent in situated visualization design.
4.5Comparison with Existing Frameworks
The SCORE framework builds upon foundational definitions of situatedness [8, 81, 82] while offering a distinct perspective from recent taxonomies proposed by Shin et al. [70] and Lee et al. [49]. While these prior works categorize situated visualization based on functional mechanics or visual idioms, SCORE characterizes them based on diegetic integration, the perceptual degree to which a visualization belongs to its environment. By viewing our results through the lenses of these complementary frameworks, we identify critical intersections between design intent, visual form, and diegetic integration.
Functional Mechanics vs. Diegesis: Shin et al. [70] classify situated analytics systems based on functional triggers (e.g., location vs. object) and anchoring mechanisms (device-fixed vs. world-registered). Their taxonomy effectively asks “How does the system work?” whereas SCORE asks “How well does it blend with the environment?” Despite these differing angles, our clusters reveal profound similarities with their functional archetypes. Our Contextual category, defined by high concreteness and coherence, strongly mirrors Shin et al.’s [70] Simulators (C1), which employ physical data abstraction to enhance “authenticity and immersion”. Conversely, our Proximal category aligns closely with their Assistants (C2) and Scanners (C4). These systems typically prioritize informational utility over physical blending, using abstract 2D overlays to guide users or annotate objects. This suggests that high diegesis is often required for simulation tasks, while lower diegesis is acceptable, and often standard, for analytical assistance.
Visual Idioms vs. Diegesis: Similarly, Lee et al. [49] provide a vocabulary of visual idioms (e.g., ghost, decal, panel) to describe how information is overlaid on, attached to, or positioned around physical referents. Mapping these idioms to SCORE reveals how specific design patterns instantiate different levels of diegesis. The Ghost and Morph patterns, which mimic or alter physical geometry, are primary mechanisms used to achieve the high coherence found in our Contextual cluster. Lee et al.’s Decal and Glyph patterns, which apply textures or marks directly to surfaces, correspond precisely to our Integrated category. Finally, the Panel and floating Label patterns map directly to our Proximal cluster, representing the standard “information overlay” approach where abstract charts are spatially situated but visually distinct from the physical narrative.
Taken together, these frameworks offer complementary perspectives on the same design landscape. This situates SCORE as complementary to these frameworks, adding a diegetic lens to it.
5Discussion
Through the application of the SCORE framework to a diverse corpus of AR-based Situated Visualizations, our analysis positions diegesis as a new conceptual lens that complements existing SV frameworks and theories. Given the definitions established in Section 2.4, our framework effectively describes the diegetic aspects of an SV, both qualitatively through its dimensional properties and quantitatively via the SCORE formula. Rather than categorizing a visualization as simply fully, partially, or non-diegetic [36, 59], the framework enables researchers to define the diegetic profile of a visualization on a continuous scale. This quantification allows for the rigorous comparison of design strategies, as demonstrated by our cluster analysis, which revealed five distinct categories of diegetic SV. Through this comparative capability, we offer a tool that reveals additional patterns in the utility of different approaches to SV design. For instance, how do these approaches impact the “bandwidth” of information that can be conveyed [28] or the level of accuracy with which it can be interpreted? Although revealing these insights may require multiple studies that apply the SCORE framework, we discuss some initial conclusions from our survey sample in the following sections. Finally, to inform the design of diegetic SV, we outline design insights from our analyses, highlighting which aspects of each dimension primarily drive diegesis and which more directly shape situatedness.
5.1Applying SCORE to AR-Based Situated Visualization
The concept of diegesis has rarely been explicitly linked with AR-based situated visualization in existing literature [86]. However, our corpus analysis reveals several instances of SV that align closely with the diegetic qualities outlined in Section 2.4. In particular, all examples within the Contextual category (Section 4.2.1) can be considered as highly diegetic visualizations.
Analyzing the Contextual category through the lens of the SCORE framework indicates that visualizations representing concrete virtual objects, those aligning closely with users’ mental models and perceived as inherent parts of the environment, fit best with our conception of diegetic visualization. For example, visualizations employing familiar concrete objects, such as sugar cubes (Figure 1a), are more diegetic compared to stylized shapes (Figure 1d). Abstract representations, specifically text, commonly used in AR-Based SV, can still achieve diegetic qualities by embedding visualizations directly onto their physical referents (Figure 6b) or onto nearby physical objects, rather than floating them arbitrarily in space (Figure 8c), which may cause them to be perceived as less diegetic. Furthermore, analyzing moderately diegetic categories, such as Hypernatural and Integrated, highlights the importance of Spatial Proximity and Coherence. These categories revealed that visualizations in AR-Based SV frequently align closely with the referent but often lack alignment with their broader environment (Figure 7a), diminishing overall diegesis.
Prior work demonstrated that diegetic representations can enhance immersion, engagement, and presence [36, 50, 56, 59, 68]. However, diegetic approaches are not universally beneficial, and their effectiveness depends heavily on context [44, 64]. Several studies have reported mixed or unexpected outcomes when employing diegetic cues, often noting that diegetic elements risk going unnoticed by users [23, 59, 64]. Although these limitations have primarily emerged from specific contexts such as game design and attention guidance, they prompt a broader need for a systematic approach to balancing the components of diegesis. Our SCORE framework facilitates this by linking the five core components to a structured design space for situated visualization, providing a Foundation for managing these trade-offs effectively.
5.2Why Quantifying Diegesis?
While the mathematical formulation of SCORE produces a precise index, we must clarify the rationale for quantifying a concept as qualitative as Diegesis. Existing frameworks [13, 36, 59, 61] often rely on binary classifications, categorizing a visualization as simply “diegetic” or “non-diegetic”. However, in AR-Based Situated Visualization, where virtual objects must coexist with physical environments, such binary labels obscure critical design nuances.
The limitations of simplified classification become evident when analyzing complex design spaces. Consider the contrast between the colored spheres and the virtual smoke in Figure 2b-c. Under prior taxonomies [49, 81, 82], both designs might be classified identically as “Embedded” as they share a spatial position near their referent. Even applying conventional definitions [13, 36, 59] to label the spheres as “non-diegetic” and the smoke as “fully diegetic” fails to capture the granularity of the user experience. This binary approach prevents researchers from reasoning about design trade-offs or isolating the specific factors that drive integration. In practice, categorical labels can be complemented by a continuous spectrum to more clearly differentiate such designs.
Our framework addresses this by evaluating designs across the five SCORE dimensions. This quantification reveals a clear separation: the spheres receive a SCORE of 0.97 (Low), while the smoke achieves 4.35 (High). Beyond simple differentiation, the numeric profile provides opportunities for refinement. For instance, while the smoke is highly integrated, the score reveals it is not “perfect”; specific dimensions, e.g., static positioning, prevent a seamless experience. Thus, quantification allows researchers to profile a visualization’s degree of integration and reason about how specific dimensional shifts influence the overall design.
Importantly, the goal of this quantification is not to measure latent human traits or subjective states (e.g., BeauVis [40], NASA-TLX [39], PREVis [10]), which would indeed require large-scale psychometric validation. Instead, SCORE is designed to characterize system design properties. The quantification serves a practical methodological purpose: it enables the systematic profiling of visualization techniques and facilitates the cluster analysis required to identify distinct design archetypes. The resulting “score” is not a normative grade of quality, but a descriptive coordinate that locates a design within the broader design space. Thus, our validation in Section 3.4 focused on descriptive power and reproducibility rather than user satisfaction. The high inter-rater reliability confirms that different researchers can apply the framework to arrive at consistent profiles—a necessary prerequisite for identifying stable design archetypes.
5.3The Unexpected Importance of Coherence
Interestingly, Coherence is the SCORE dimension that is least explicitly explored in prior literature. Yet, our cluster analysis reveals a clear relationship between Coherence and Diegesis: high Coherence often correlates with high Diegesis. Moving from highly diegetic clusters (e.g.,"Contextual" in Figure 5) to less diegetic clusters (e.g., "Proximal" in Figure 9), Coherence decreases predictably. This suggests that when a virtual object aligns with the user’s mental model, it is more likely to be categorised as diegetic.
Achieving perfect coherence between visualizations and users’ mental models is itself a challenging task, given current limitations in AR technologies. For instance, rendering quality [5, 33], spatial tracking accuracy [41, 74], and the density of virtual content [49] can affect how precisely visualizations align with user expectations. This becomes especially apparent when multiple virtual elements correspond to the same real-world referent (Figure 9c). Additionally, SV research predominantly emphasizes spatial placement and technical implementation, with limited attention to aesthetic design and visual representation of data within contextual environments [8].
Prior research has shown that misalignments in visual attributes (e.g., shape[24, 42, 89], color [2, 5, 24], positioning [88], or behavior [59, 87]) can undermine immersion. By contrast, visualizations that closely match the user’s mental model tend to have a stronger psychological impact [81]. For example, in Figure 2c, participants preferred the smoke-based visualization over the sphere one, despite it being less effective for conveying quantitative data. In contrast, in Figure 7b, the virtual railing was perceived as distracting and difficult to interpret due to its misalignment with users’ mental models.
Although Coherence is conceptually orthogonal to other diegetic dimensions, our findings reveal a remarkably notable positive correlation between Coherence and Environmental Context (r = 0.90, Table 2). This suggests that a visualization’s plausibility is deeply intertwined with how well it integrates into its surroundings; what feels consistent with our mental model is what we perceive as belonging in the environment. This relationship highlights a critical design trade-off. In the Hypernatural cluster, we observed that visual content is often intentionally stylized to enhance user engagement [17, 50, 73]. While applications, such as AR Hero [73] and MARVisT [17], use stylized visualizations to engage users, other studies caution that excessive stylization can reduce immersion by decreasing visual coherence[89]. Designers should therefore tune Coherence based on whether the goal is to maximize immersion, foster engagement, or balance both.
5.4Design Insights
Based on our cluster analysis, we identified several insights that can help visualization designers and researchers in designing diegetic situated visualizations:
Spatial proximity has a stronger influence on situatedness than on diegesis. A visualization placed far from its referent can still achieve high diegesis if other dimensions (e.g., coherence, contextual alignment) reflect higher value. Conversely, one placed closer to its referent does not necessarily reveal a more intimate connection with that object’s broader context based on spatial proximity alone. This independence allows designers to explore distant placements to reduce visual clutter or avoid physical obstruction, but it introduces a critical trade-off: as the visualization moves away from its object, the design must compensate by strengthening Referential Context and Coherence. We observe this tension in Proximal clusters, where designers often utilize explicit visual links (Figure 1e, Figure 9c) to secure the relationship between the visualization and its referent; while effective for reference, these added elements frequently disrupt the visual flow, ultimately hindering Coherence.
Concrete visualizations are more likely to be perceived as diegetic than abstract ones, as they provide a clear sense of physicality within the environment. Nevertheless, fully abstract visualizations (e.g., text) can also achieve diegesis by meaningful anchoring to nearby physical referents or surrounding concrete objects. By tightly integrating with concrete objects, these abstract forms effectively “borrow” reality from their surroundings, establishing a meaningful and grounded presence without needing to mimic physical matter. When visualizations are directly embedded onto physical referents or nearby concrete objects, the environmental context becomes less influential. In these cases, both diegesis and situatedness primarily depend on referential alignment. For instance, displaying text on a floating panel often lowers diegesis because it appears superimposed over the environment rather than existing within it. However, physically anchoring the visualization can significantly alter this perception. As seen in Figure 5b, a sticky note attached to a refrigerator is fundamentally just abstract text, yet its specific attachment enhances its overall diegesis, creating a convincing sense of belonging to the physical space.
Coherence strongly correlates with diegesis. Factors such as visual appearance, placement, and behavior of virtual objects should align with users’ mental models to enhance diegesis. Interestingly, even visually incoherent visualizations (e.g., cartoonish paintings placed on walls) can still be perceived as diegetic if their placement and context are appropriate.
Referential context aligns more closely with situatedness, while environmental context aligns more closely with diegesis. To be diegetic, visualizations must be aligned with the environment; to be situated, they must relate to their referents. This distinction explains why a floating text panel often breaks diegesis; it appears superimposed over the environment rather than existing within it. However, physically anchoring the visualization significantly alters this perception. As seen in Figure 5b, a sticky note attached to a refrigerator is fundamentally just abstract text, yet its specific attachment enhances its overall diegesis, creating a convincing sense that it belongs to the physical space.
Using metaphorical visualizations (e.g., smoke for pollution in Figure 2c; sugar cubes for calories 1a) can strengthen psychological impact, improving both contextual alignment and coherence. Furthermore, incorporating intuitive behaviors into virtual objects (e.g., a virtual dog acknowledging the user or an object falling due to gravity) enhances coherence.
6Limitations and Future Directions
Like any framework, SCORE has important boundaries that suggest critical avenues for future research. First, its development was scoped to Augmented Reality, where the interplay between physical and virtual worlds is most pronounced. Future work should examine how SCORE’s dimensions, particularly Environmental Context and Coherence, can be adapted for fully virtual environments or data physicalizations, where materiality and physical laws impose different constraints.
Second, SCORE evaluates the conceptual strength of a visualization, abstracting away from technical implementation factors. In practice, achieving diegesis is strongly influenced by rendering fidelity, lighting consistency, tracking accuracy, and occlusion handling. A direction for future research is to investigate the relationship between these technical benchmarks and SCORE’s perceptual dimensions. For example, how much tracking jitter is permissible before a visualization’s Coherence score is compromised?
Third, we acknowledge that quantifying qualitative design dimensions is inherently subjective [7, 37]. For instance, regarding the virtual milk glass (Figure 7b) or keyboard examples (Figure 1c), a viewer’s perception of attributes like Coherence can be influenced by subtle factors such as color usage, physical attributes (e.g., height, width), logical placement, or visual appearance. To minimize this variability, we introduced detailed rubrics to anchor evaluations to specific, defined criteria rather than relying solely on intuition. Specifically, in scenarios where a visualization exhibits a “dual presence”, our rubric is designed to help users capture the dominant design perspective to ensure consistency. In addition, we only recruited participants with 3+ years of AR/VR experience to ensure more consistent and informed judgments. We recognize, however, that distinct interpretations are a natural result of such design spaces; an avenue for future work to explicitly study how perception of these categories varies across different levels of expertise and user groups.
Finally, while our cluster analysis revealed prevalent design patterns in SV, it necessarily simplifies a continuous design space. Real-world systems may exhibit hybrid properties that do not fit neatly into these classifications. We see this not as a weakness but as an opportunity to explore the nuanced design space between clusters. Further work should include controlled studies to establish causal links between SCORE dimensions and cognitive and affective outcomes, such as cognitive load, attention, and trust. By providing a foundational vocabulary for diegesis, we hope SCORE will inspire a new wave of research aimed at creating truly integrated and intuitive situated visualizations in Augmented Reality.
7Conclusion
In this paper, we introduced SCORE, a novel framework for systematically analyzing and quantifying diegesis in AR-Based SV. Moving beyond existing models that primarily emphasize spatial positioning, SCORE provides a multi-dimensional approach for evaluating how deeply a visualization is integrated into its physical environment. Our framework defines five key dimensions—Spatial Proximity, Concreteness, Coherence, Referential Context, and Environmental Context—derived from a systematic analysis of 50 contemporary SV works. Through a cluster analysis, we identified five recurring categories of diegetic design: Contextual, Integrated, Hypernatural, Superimposed, and Proximal. These categories reveal distinct patterns and trade-offs in SV design, offering a richer vocabulary for researchers and designers.
Acknowledgments
This work was funded by NSERC Discovery Grant (#RGPIN-2019- 05211) and the Canada Foundation for Innovation Infrastructure Fund (#40440). We thank Michael Neylan and Thomas Chandler for introducing the authors to the concept of diegesis in games and immersive environments, which provided the initial inspiration for this work.
- 1Public demo: https://github.com/tarik19x/DiegeticVisExplorer (accessed September 11, 2025).
References
- [1]Electronic Arts. 2025. Dead Space. https://www.ea.com/en-ca/games/dead-space Accessed: 2025-03-22.
- [2]Omeed Ashtiani, Hung-Jui Guo, and Balakrishnan Prabhakaran. 2023. Impact of motion cues, color, and luminance on depth perception in optical see-through AR displays. Frontiers in Virtual Reality 4 (2023), 1243956.
- [3]Ambre Assor, Arnaud Prouzeau, Pierre Dragicevic, and Martin Hachet. 2024. Augmented reality waste accumulation visualizations. ACM Journal on Computing and Sustainable Societies 2, 2 (2024), 1–29.
- [4]Thomas Beck and Sylvia Rothe. 2021. Applying diegetic cues to an interactive virtual reality experience. In 2021 IEEE Conference on Games (CoG). IEEE, 1–8.
- [5]Saeed Boorboor, Matthew S Castellana, Yoonsang Kim, Chen Zhu-Tian, Johanna Beyer, Hanspeter Pfister, and Arie E Kaufman. 2023. Voxar: Adaptive visualization of volume rendered objects in optical see-through augmented reality. IEEE Transactions on Visualization and Computer Graphics 30, 10 (2023), 6801–6812.
- [6]Doug A. Bowman, Ryan P. McMahan, and Eric D. Ragan. 2012. Questioning naturalism in 3D user interfaces. Commun. ACM 55, 9 (Sept. 2012), 78–88. doi:10.1145/2330667.2330687
- [7]Virginia Braun and Victoria Clarke. 2006. Using thematic analysis in psychology. Qualitative research in psychology 3, 2 (2006), 77–101.
- [8]Nathalie Bressa, Henrik Korsgaard, Aurélien Tabard, Steven Houben, and Jo Vermeulen. 2021. What’s the situation with situated visualization? A survey and perspectives on situatedness. IEEE Transactions on Visualization and Computer Graphics 28, 1 (2021), 107–117.
- [9]Remigius Bunia. 2010. Diegesis and representation: beyond the fictional world, on the margins of story and narrative. Poetics Today 31, 4 (2010), 679–720.
- [10]Anne-Flore Cabouat, Tingying He, Petra Isenberg, and Tobias Isenberg. 2024. PREVis: Perceived readability evaluation for visualizations. IEEE Transactions on Visualization and Computer Graphics (2024).
- [11]Arthur Caetano, Alyssa Lawson, Yimeng Liu, and Misha Sra. 2023. ARLang: An outdoor augmented reality application for portuguese vocabulary learning. In Proceedings of the 2023 ACM Designing Interactive Systems Conference. 1224–1235.
- [12]Tadeusz Caliński and Jerzy Harabasz. 1974. A dendrite method for cluster analysis. Communications in Statistics 3, 1 (1974), 1–27. doi:10.1080/03610927408827101
- [13]Anil Camci. 2019. Exploring the effects of diegetic and non-diegetic audiovisual cues on decision-making in virtual reality. paper/Exploring-the-Effects-of-Diegetic-and-Non-diegetic-% C3% 87amci/e3bf1083e493ba68b81d47e45f1d5295e17302d4 (2019).
- [14]Joint Research Centre. 2008. Handbook on constructing composite indicators: methodology and user guide. OECD publishing.
- [15]Hsin-Yi Chang, Theerapong Binali, Jyh-Chong Liang, Guo-Li Chiou, Kun-Hung Cheng, Silvia Wen-Yu Lee, and Chin-Chung Tsai. 2022. Ten years of augmented reality in education: A meta-analysis of (quasi-) experimental studies to investigate the impact. Computers & Education 191 (2022), 104641.
- [16]Yi-Sheng Chao and Chao-Jung Wu. 2017. Principal component-based weighted indices and a framework to evaluate indices: Results from the Medical Expenditure Panel Survey 1996 to 2011. PLoS One 12, 9 (2017), e0183997.
- [17]Zhutian Chen, Yijia Su, Yifang Wang, Qianwen Wang, Huamin Qu, and Yingcai Wu. 2019. Marvist: Authoring glyph-based visualization in mobile augmented reality. IEEE transactions on visualization and computer graphics 26, 8 (2019), 2645–2658.
- [18]Fanny Chevalier, Romain Vuillemot, and Guia Gali. 2013. Using concrete scales: A practical framework for effective visual depiction of complex measures. IEEE transactions on visualization and computer graphics 19, 12 (2013), 2426–2435.
- [19]Subramanian Chidambaram, Hank Huang, Fengming He, Xun Qian, Ana M Villanueva, Thomas S Redick, Wolfgang Stuerzlinger, and Karthik Ramani. 2021. Processar: An augmented reality-based tool to create in-situ procedural 2d/3d ar instructions. In Proceedings of the 2021 ACM Designing Interactive Systems Conference. 234–249.
- [20]Wikipedia contributors. 2025. Deathloop — Wikipedia, The Free Encyclopedia. https://en.wikipedia.org/wiki/Deathloop Accessed: 2025-03-22.
- [21]Wikipedia contributors. 2025. Metro 2033 (video game) — Wikipedia, The Free Encyclopedia. https://en.wikipedia.org/wiki/Metro_2033_(video_game) Accessed: 2025-03-22.
- [22]David L. Davies and Donald W. Bouldin. 1979. A cluster separation measure. IEEE Transactions on Pattern Analysis and Machine Intelligence PAMI-1, 2 (1979), 224–227. doi:10.1109/TPAMI.1979.4766909
- [23]Kody R Dillman, Terrance Tin Hoi Mok, Anthony Tang, Lora Oehlberg, and Alex Mitchell. 2018. A visual interaction cue framework from video game environments for augmented reality. In Proceedings of the 2018 CHI conference on human factors in computing systems. 1–12.
- [24]Tiffany D Do, Joseph J LaViola, and Ryan P McMahan. 2020. The effects of object shape, fidelity, color, and luminance on depth perception in handheld mobile augmented reality. In 2020 IEEE International symposium on mixed and augmented reality (ISMAR). IEEE, 64–72.
- [25]Paul Dourish. 2004. What we talk about when we talk about context. Personal and ubiquitous computing 8, 1 (2004), 19–30.
- [26]Neven AM ElSayed, Bruce H Thomas, Kim Marriott, Julia Piantadosi, and Ross T Smith. 2016. Situated analytics: Demonstrating immersive analytical tools with augmented reality. Journal of Visual Languages & Computing 36 (2016), 13–23.
- [27]Ulrich Engelke, Holly Hutson, Huyen Nguyen, and Paulo de Souza. 2016. Melissar: Towards augmented visual analytics of honey bee behaviour. In Proceedings of the 2016 CHI Conference Extended Abstracts on Human Factors in Computing Systems. 2057–2063.
- [28]Barrett Ens, Benjamin Bach, Maxime Cordeil, Ulrich Engelke, Marcos Serrano, Wesley Willett, Arnaud Prouzeau, Christoph Anthes, Wolfgang Büschel, Cody Dunne, et al. 2021. Grand challenges in immersive analytics. In Proceedings of the 2021 CHI Conference on Human Factors in Computing Systems. 1–17.
- [29]Barrett Ens and Pourang Irani. 2017. Spatial Analytic Interfaces: Spatial User Interfaces for In Situ Visual Analytics. IEEE Computer Graphics and Applications 37, 2 (2017), 66–79. doi:10.1109/MCG.2016.38
- [30]Erik Fagerholt and Magnus Lorentzon. 2009. Beyond the HUD-user interfaces for increased player immersion in FPS games. (2009).
- [31]George W Fitzmaurice. 1993. Situated information spaces and spatially aware palmtop computers. Commun. ACM 36, 7 (1993), 39–49.
- [32]Lukas A Flohr, Joseph Sebastian Valiyaveettil, Antonio Krüger, and Dieter P Wallach. 2023. Prototyping autonomous vehicle windshields with AR and real-time object detection visualization: an on-road wizard-of-oz study. In Proceedings of the 2023 ACM designing interactive systems conference. 2123–2137.
- [33]Santina Fortuna, Loris Barbieri, Emanuele Marino, and Fabio Bruno. 2024. A comparative study of Augmented Reality rendering techniques for industrial assembly inspection. Computers in Industry 155 (2024), 104057.
- [34]Zeinab Ghaemi, Kadek Ananta Satriadi, Ulrich Engelke, Barrett Ens, and Bernhard Jenny. 2023. Visualization placement for outdoor augmented data tours. In Proceedings of the 2023 ACM Symposium on Spatial User Interaction. 1–14.
- [35]Claudia Gorbman. 1987. Unheard melodies: Narrative film music. Indiana University Press.
- [36]Matt Gottsacker, Nahal Norouzi, Kangsoo Kim, Gerd Bruder, and Greg Welch. 2021. Diegetic representations for seamless cross-reality interruptions. In 2021 IEEE International Symposium on Mixed and Augmented Reality (ISMAR). IEEE, 310–319.
- [37]Saul Greenberg and Bill Buxton. 2008. Usability evaluation considered harmful (some of the time). In Proceedings of the SIGCHI conference on Human factors in computing systems. 111–120.
- [38]Jiahao Han, Zhifei Ding, Yuxuan Chen, Lingxin Yu, Siru Chen, and Richen Liu. 2023. PMM: A Smart Shopping Guider Based on Mobile AR. In Proceedings of the 16th International Symposium on Visual Information Communication and Interaction. 1–8.
- [39]Sandra G Hart and Lowell E Staveland. 1988. Development of NASA-TLX (Task Load Index): Results of empirical and theoretical research. In Advances in psychology. Vol. 52. Elsevier, 139–183.
- [40]Tingying He, Petra Isenberg, Raimund Dachselt, and Tobias Isenberg. 2022. BeauVis: A validated scale for measuring the aesthetic pleasure of visual representations. IEEE Transactions on Visualization and Computer Graphics 29, 1 (2022), 363–373.
- [41]Tianyi Hu, Fan Yang, Tim Scargill, and Maria Gorlatova. 2024. Apple vs Meta: A Comparative Study on Spatial Tracking in SOTA XR Headsets. In Proceedings of the 30th Annual International Conference on Mobile Computing and Networking. 2120–2127.
- [42]Florian Jasche, Sven Hoffmann, Thomas Ludwig, and Volker Wulf. 2021. Comparison of different types of augmented reality visualizations for instructions. In Proceedings of the 2021 CHI Conference on Human Factors in Computing Systems. 1–13.
- [43]Ian Jolliffe. 2011. Principal component analysis. In International encyclopedia of statistical science. Springer, 1094–1096.
- [44]Kristine Jørgensen. 2011. Time for new terminology?: Diegetic and non-diegetic sounds in computer games revisited. In Game sound technology and player interaction: Concepts and developments. IGI Global, 78–97.
- [45]Hyungil Kim, Joseph L Gabbard, Alexandre Miranda Anon, and Teruhisa Misu. 2018. Driver behavior and performance with augmented reality pedestrian collision warning: An outdoor user study. IEEE transactions on visualization and computer graphics 24, 4 (2018), 1515–1524.
- [46]Erica Kleinman, Elin Carstensdottir, and Magy Seif El-Nasr. 2019. A model for analyzing diegesis in digital narrative games. In Interactive Storytelling: 12th International Conference on Interactive Digital Storytelling, ICIDS 2019, Little Cottonwood Canyon, UT, USA, November 19–22, 2019, Proceedings 12. Springer, 8–21.
- [47]Kay Köhle, Matthias Hoppe, Albrecht Schmidt, and Ville Mäkelä. 2021. Diegetic and non-diegetic health interfaces in VR shooter games. In Human-Computer Interaction–INTERACT 2021: 18th IFIP TC 13 International Conference, Bari, Italy, August 30–September 3, 2021, Proceedings, Part III 18. Springer, 3–11.
- [48]Jérôme Kudnick and Martin Weier. 2023. Immersive Diegetic Visualization of Multivariate Data. In GI VR/AR Workshop. Gesellschaft für Informatik eV, 10–18420.
- [49]Benjamin Lee, Michael Sedlmair, and Dieter Schmalstieg. 2023. Design patterns for situated visualization in augmented reality. IEEE Transactions on Visualization and Computer Graphics (2023).
- [50]Jingya Li, Erik D Van der Spek, Jun Hu, and Loe Feijs. 2019. Turning your book into a game: improving motivation through tangible interaction and diegetic feedback in an AR mathematics game for children. In Proceedings of the annual symposium on computer-human interaction in play. 73–85.
- [51]Weizhou Luo, Zhongyuan Yu, Rufat Rzayev, Marc Satkowski, Stefan Gumhold, Matthew McGinity, and Raimund Dachselt. 2023. Pearl: Physical environment based augmented reality lenses for in-situ human movement analysis. In Proceedings of the 2023 CHI Conference on Human Factors in Computing Systems. 1–15.
- [52]Quentin Marre, Loïc Caroux, and Jean-Christophe Sakdavong. 2021. Video game interfaces and diegesis: the impact on experts and novices’ performance and experience in virtual reality. International Journal of Human–Computer Interaction 37, 12 (2021), 1089–1103.
- [53]Nuno Cid Martins, Bernardo Marques, Paulo Dias, and Beatriz Sousa Santos. 2023. Expanding the horizons of situated visualization: The extended sv model. Big Data and Cognitive Computing 7, 2 (2023), 112.
- [54]Tamara Munzner. 2025. Visualization analysis and design. In Proceedings of the Special Interest Group on Computer Graphics and Interactive Techniques Conference Courses. 1–2.
- [55]Nassir Navab, Alejandro Martin-Gomez, Matthias Seibold, Michael Sommersperger, Tianyu Song, Alexander Winkler, Kevin Yu, and Ulrich Eck. 2022. Medical augmented reality: definition, principle components, domain modeling, and design-development-validation process. Journal of Imaging 9, 1 (2022), 4.
- [56]Lasse T Nielsen, Matias B Møller, Sune D Hartmeyer, Troels CM Ljung, Niels C Nilsson, Rolf Nordahl, and Stefania Serafin. 2016. Missing the point: an exploration of how to guide users’ attention during cinematic virtual reality. In Proceedings of the 22nd ACM conference on virtual reality software and technology. 229–232.
- [57]Adam Nieman. 2011. Concrete vs abstract visualisation. Proceedings of the ADSVIS (2011), 49–56.
- [58]Niels Chr Nilsson, Rolf Nordahl, and Stefania Serafin. 2016. Immersion revisited: A review of existing definitions of immersion and their relation to different theories of presence. Human technology 12, 2 (2016), 108–134.
- [59]Nahal Norouzi, Gerd Bruder, Austin Erickson, Kangsoo Kim, Jeremy Bailenson, Pamela Wisniewski, Charlie Hughes, and Greg Welch. 2021. Virtual animals as diegetic attention guidance mechanisms in 360-degree experiences. IEEE Transactions on Visualization and Computer Graphics 27, 11 (2021), 4321–4331.
- [60]Oxford University Press. 2023. Oxford English Dictionary (3rd ed.). Oxford University Press, Oxford. https://www.oed.com/ Accessed: 2024-11-09.
- [61]Margaree Peacocke, Robert J Teather, Jacques Carette, and I Scott MacKenzie. 2015. Evaluating the effectiveness of HUDs and diegetic ammo displays in first-person shooter games. In 2015 IEEE Games Entertainment Media Conference (GEM). IEEE, 1–8.
- [62]Xun Qian, Fengming He, Xiyun Hu, Tianyi Wang, Ananya Ipsita, and Karthik Ramani. 2022. Scalar: Authoring semantically adaptive augmented reality experiences in virtual reality. In Proceedings of the 2022 CHI Conference on Human Factors in Computing Systems. 1–18.
- [63]Sebastian Rigling, Xingyao Yu, and Michael Sedlmair. 2023. “In Your Face!”: Visualizing Fitness Tracker Data in Augmented Reality. In Extended Abstracts of the 2023 CHI Conference on Human Factors in Computing Systems. 1–7.
- [64]Damien Constantine Rompapas, Christian Sandor, Alexander Plopski, Daniel Saakes, Joongi Shin, Takafumi Taketomi, and Hirokazu Kato. 2019. Towards large scale high fidelity collaborative augmented reality. Computers & Graphics 84 (2019), 24–41.
- [65]Harits Ar Rosyid, Arief Yoga Pangestu, and Muhammad Iqbal Akbar. 2021. Can Diegetic User Interface Improves Immersion in Role-Playing Games?. In 2021 7th International Conference on Electrical, Electronics and Information Engineering (ICEEIE). IEEE, 200–204.
- [66]Sylvia Rothe and Heinrich Hußmann. 2018. Guiding the viewer in cinematic virtual reality by diegetic cues. In Augmented Reality, Virtual Reality, and Computer Graphics: 5th International Conference, AVR 2018, Otranto, Italy, June 24–27, 2018, Proceedings, Part I 5. Springer, 101–117.
- [67]Peter J. Rousseeuw. 1987. Silhouettes: A graphical aid to the interpretation and validation of cluster analysis. J. Comput. Appl. Math. 20 (1987), 53–65. doi:10.1016/0377-0427(87)90125-7
- [68]Paola Salomoni, Catia Prandi, Marco Roccetti, Lorenzo Casanova, and Luca Marchetti. 2016. Assessing the efficacy of a diegetic game interface with Oculus Rift. In 2016 13th IEEE Annual Consumer Communications & Networking Conference (CCNC). IEEE, 387–392.
- [69]Joon Gi Shin, Gary Ng, and Daniel Saakes. 2018. Couples designing their living room together: A study with collaborative handheld augmented reality. In Proceedings of the 9th Augmented Human International Conference. 1–9.
- [70]Sungbok Shin, Andrea Batch, Peter WS Butcher, Panagiotis D Ritsos, and Niklas Elmqvist. 2023. The reality of the situation: A survey of situated analytics. IEEE Transactions on Visualization and Computer Graphics (2023).
- [71]Ronell Sicat, Jiabao Li, Junyoung Choi, Maxime Cordeil, Won-Ki Jeong, Benjamin Bach, and Hanspeter Pfister. 2018. DXR: A toolkit for building immersive data visualizations. IEEE transactions on visualization and computer graphics 25, 1 (2018), 715–725.
- [72]Avinash Kumar Singh, Jia Liu, Carlos A Tirado Cortes, and Chin-Teng Lin. 2021. Virtual global landmark: An augmented reality technique to improve spatial navigation learning. In Extended abstracts of the 2021 CHI conference on human factors in computing systems. 1–6.
- [73]Lucchas Ribeiro Skreinig, Ana Stanescu, Shohei Mori, Frank Heyen, Peter Mohr, Michael Sedlmair, Dieter Schmalstieg, and Denis Kalkofen. 2022. Ar hero: Generating interactive augmented reality guitar tutorials. In 2022 IEEE Conference on Virtual Reality and 3D User Interfaces Abstracts and Workshops (VRW). IEEE, 395–401.
- [74]Toqeer Ali Syed, Muhammad Shoaib Siddiqui, Hurria Binte Abdullah, Salman Jan, Abdallah Namoun, Ali Alzahrani, Adnan Nadeem, and Ahmad B Alkhodre. 2022. In-depth review of augmented reality: Tracking technologies, development tools, AR displays, collaborative AR, and security concerns. Sensors 23, 1 (2022), 146.
- [75]Tableau. n.d.. What Is Data Visualization? Definition & Examples. https://www.tableau.com/visualization/what-is-data-visualization. Accessed: 2025-08-28.
- [76]Markus Tatzgern. 2015. Situated visualization in augmented reality. Graz University of Technology (2015).
- [77]Ryan Tennant and Tania Randall. 2025. Human Performance and Perception of Uncertainty Visualizations in Geospatial Applications: A Scoping Review. IEEE Transactions on Visualization and Computer Graphics (2025).
- [78]Bruce H Thomas1, Gregory F Welch, Pierre Dragicevic, Niklas Elmqvist, Pourang Irani, Yvonne Jansen, Dieter Schmalstieg, Aurélien Tabard, Neven AM ElSayed, Ross T Smith1, et al. 2018. 7. Situated Analytics. Immersive analytics 11190 (2018), 185.
- [79]Andrew Vande Moere and Dan Hill. 2016. Designing for the situated and public visualization of urban data. In Street Computing. Routledge, 24–45.
- [80]Vanissa Wanick, Jessica Castle, and Alexander Wittig. 2019. Applying games design thinking for scientific data visualization in virtual reality environments. (2019).
- [81]Sean White and Steven Feiner. 2009. SiteLens: situated visualization techniques for urban site visits. In Proceedings of the SIGCHI conference on human factors in computing systems. 1117–1120.
- [82]Wesley Willett, Yvonne Jansen, and Pierre Dragicevic. 2016. Embedded data representations. IEEE transactions on visualization and computer graphics 23, 1 (2016), 461–470.
- [83]Ben Winters. 2010. The non-diegetic fallacy: Film, music, and narrative space. Music and Letters 91, 2 (2010), 224–244.
- [84]Claes Wohlin. 2014. Guidelines for snowballing in systematic literature studies and a replication in software engineering. In Proceedings of the 18th international conference on evaluation and assessment in software engineering. 1–10.
- [85]Mingze Xi, Madhawa Perera, Stuart Anderson, and Matt Adcock. 2024. Towards situated imaging. In 2024 IEEE International Conference on Artificial Intelligence and eXtended and Virtual Reality (AIxVR). IEEE, 85–89.
- [86]Lijie Yao, Federica Bucchieri, Victoria McArthur, Anastasia Bezerianos, and Petra Isenberg. 2024. User experience of visualizations in motion: A case study and design considerations. IEEE Transactions on Visualization and Computer Graphics (2024).
- [87]Hui Ye, Jiaye Leng, Pengfei Xu, Karan Singh, and Hongbo Fu. 2024. ProInterAR: A Visual Programming Platform for Creating Immersive AR Interactions. In Proceedings of the 2024 CHI Conference on Human Factors in Computing Systems. 1–15.
- [88]Kexin Zhang, Brianna R Cochran, Ruijia Chen, Lance Hartung, Bryce Sprecher, Ross Tredinnick, Kevin Ponto, Suman Banerjee, and Yuhang Zhao. 2024. Exploring the Design Space of Optical See-through AR Head-Mounted Displays to Support First Responders in the Field. In Proceedings of the CHI Conference on Human Factors in Computing Systems. 1–19.
- [89]Yuhang Zhao, Elizabeth Kupferstein, Brenda Veronica Castro, Steven Feiner, and Shiri Azenkot. 2019. Designing AR visualizations to facilitate stair navigation for people with low vision. In Proceedings of the 32nd annual ACM symposium on user interface software and technology. 387–402.
- [90]Chen Zhu-Tian, Wai Tong, Qianwen Wang, Benjamin Bach, and Huamin Qu. 2020. Augmenting static visualizations with paparvis designer. In Proceedings of the 2020 CHI Conference on Human Factors in Computing Systems. 1–12.
Cite this paper
Tarik Hasan, Khalad Hasan, and Barrett Ens. 2026. SCORE: A Framework for Quantifying Diegesis in Situated Visualization for Augmented Reality. In Proceedings of the 2026 CHI Conference on Human Factors in Computing Systems (CHI '26), April 13–17, 2026, Barcelona, Spain. ACM, New York, NY, USA, 19 pages. https://doi.org/10.1145/3772318.3791911
@inproceedings{hasan2026score,
  author    = {Hasan, Tarik and Hasan, Khalad and Ens, Barrett},
  title     = {{SCORE}: A Framework for Quantifying Diegesis in Situated Visualization for Augmented Reality},
  booktitle = {Proceedings of the 2026 CHI Conference on Human Factors in Computing Systems},
  series    = {CHI '26},
  year      = {2026},
  pages     = {1--19},
  publisher = {Association for Computing Machinery},
  address   = {New York, NY, USA},
  location  = {Barcelona, Spain},
  isbn      = {979-8-4007-2278-3},
  doi       = {10.1145/3772318.3791911},
  url       = {https://doi.org/10.1145/3772318.3791911}
}
© 2026 Copyright held by the owner/author(s). This work is licensed under a Creative Commons Attribution 4.0 International License. This page is a web version of the published paper; the PDF and the ACM Digital Library record are the version of record.